Using OECD data on health care expenditure

Graphs of OECD data

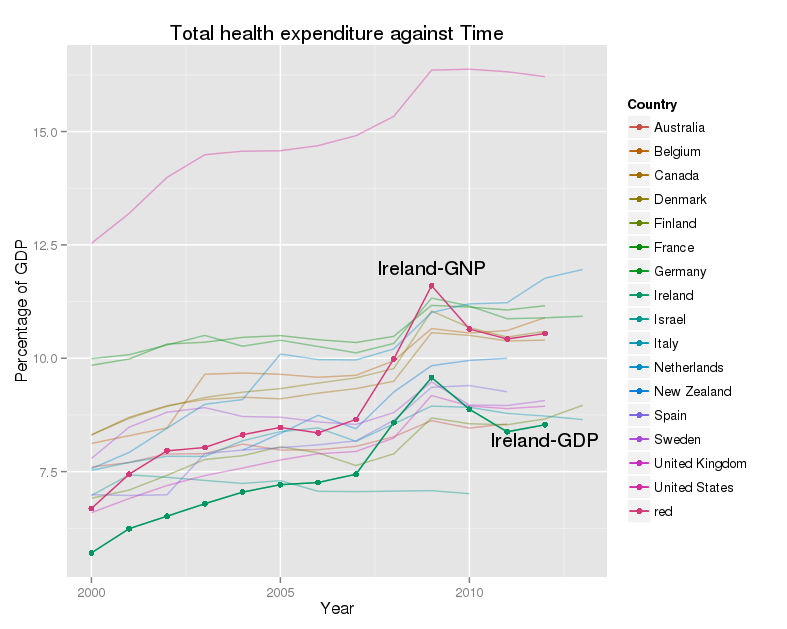
These notes are mainly to remind me how to draw graphs which use OECD data on health outcomes, health care expenditure. like this one :-


OECD data on total health care expenditure by year across a selection of countries
OECD data on total health care expenditure as a percentage of GDP by year across a selection of countries

 The data come from the OECD stats library, which still requires a subscription. You can download data in several formats. These include Excel files, and compressed comma separated variable (CSV) files. The Excel files use ‘..’ as a missing value character, and need a bit of work to remove formatting, empty columns and rows, and the like before use. The CSV files are compressed with gzip, and I’ve found problems uncompressing them on Linux. The code below seems to work though.

gzip -dfc OECDdata.csv.gz > OECDdata.csv

I use RStudio, and usually use knitr. The libraries I load are here :-

Load necessary libraries
```{r}
library(ggplot2)
library(reshape2)
library(stringr)
library(plyr)
library(scales)
```

OECD data come in wide format, with each year's data in one column, and the variables which explain it are lined up in columns beside the years like this :-
 
 "Country","Unit","2000","2001","2002","2003","2004","2005","2006","2007","2008","2009","2010","2011","2012","2013"
 "Australia","% gross domestic product",7.6015,7.7003,7.8903,7.8959,8.1065,7.975,7.9824,8.0563,8.2678,8.6248,8.4604,8.5505,"NA","NA"
 "Austria","% gross domestic product",9.4401,9.548,9.6235,9.7954,9.9059,9.8669,9.7359,9.7435,9.9469,10.5356,10.4834,10.2371,10.4102,"NA"
 "Belgium","% gross domestic product",8.1206,8.2921,8.4618,9.6474,9.6751,9.6472,9.5809,9.6237,9.9428,10.6547,10.5577,10.6107,10.8944,"NA"
 

There are 35 rows, and 16 columns in this particular file. This format is not well suited to graphing, so I need to melt it.

#Total current expenditure as a % of GDP
TCE TCEm variable.name='Year')
#Changes values of year from X2000, X2001 etc to 2000, 2001 and so on.
TCEm$Year

What does this do? The final result looks like this :-
 
 "","Country","Unit","Year","value"
 "1","Australia","% gross domestic product",2000,7.6015
 "2","Austria","% gross domestic product",2000,9.4401
 "3","Belgium","% gross domestic product",2000,8.1206
 "4","Canada","% gross domestic product",2000,8.3075
 

There is one row for each combination of the two id variable ‘Country’ and ‘Unit’ data point. Each row in the original data set leads to 14 rows, one for every year, in the molten data set.

To make this picture I used this code:-
 
 # Total current expenditure as a percentage of GDP by year
 g geom_line(aes(x=Year,y=value, group=Country,colour=Country),alpha=0.4) +
 geom_line(data = subset(TCEm,TCEm$Country %in% Ireland),
 aes(x=Year,y=value, group=Country,colour=Country)) +
 geom_point(data = subset(TCEm,TCEm$Country %in% Ireland),
 aes(x=Year,y=value, group=Country,colour=Country)) +
 geom_line(data = IrelandAdjTCEm,
 aes(x=Year,y=value.x.revised, group=Country,colour='red')) +
 geom_point(data = IrelandAdjTCEm,aes(x=Year,y=value.x.revised, group=Country,colour='red')) +
 xlab("Year")+ylab("Percentage of GDP") +
 ggtitle("Total health expenditure against Time")+ scale_colour_hue(c=100,l=50) +
 annotate('text',x=2009,y=12,label="Ireland-GNP") +
 annotate('text',x=2012,y=8.2,label="Ireland-GDP")
 g
 ggsave("TCE.png",plot=g,width=20,height=16,dpi=100,units="cm")
 

Patients First meeting in Navan

I’m just back from the Patients First meeting in Navan. This is their third meeting, but the first I’ve been able to get to. Their core goals of the campaign are :-

  1. Budget must protect health service and patient care.
  2. An independent, transparent, free, easily accessible, feedback mechanism that provides all patients, carers and family members the opportunity to share their healthcare story and engage with service providers.
  3. Safe staffing based on patient dependency alone.
  4. Legislated requirements to publicly display daily staffing levels vis-à-vis patient dependency requirements.
  5. Legislated requirements to publicly consult and assess all cost improvement plans.
  6. National long term strategy for patient involvement and engagement across Ireland.

There was a respectable attendance, with about 40 people there, in the Newgrange hotel. The audience was a mixture, with several nurses from the area, including Navan hospital, and the local hospice team; a scattering of politicians (full list on their website) including TDs Helen McEntee and Regina Doherty; a couple of people with specific stories of bad outcomes; and several other local people. The speakers were my old friend Hilary Dunne of Patient Opinion Ireland and Karen Clarke from the INMO and Drogheda. David Hughes of the INMO chaired the evening.

The format was interesting. It started with a video from the BBC about the Francis inquiry into the Mid-Staffs trust disgrace. I re-read the executive summary over the weekend, to prepare for this evening. It still shocks and upsets me. I’ve been ill and helpless in hospital in Ireland, more than once, but I always got great care. I might not have been so lucky over there. If you haven’t read it, please do.

Then Hilary and Karen spoke briefly, presenting their personal perspectives on the issue. Stephen McMahon, and Steve Tweed, who were meant to speak as well, were caught in the tailback on the M50/M1 junction, and didn’t make it over. It was passed over to the floor then. There were three patient stories, one from the patient themselves, and two from relatives. Several other people, including the local councillors and TDs spoke as well.

What did I think? This was a genuinely useful meeting. The patient stories are a powerful narrative, and serve to focus attention on why we need to reform the service. The response of the politicians was very positive and constructive. The two TDs will be going back to Minister Varadkar, and one hopes that he will take their feedback seriously. There is the nucleus of a group here to lead the wider discussion on the structure and funding of the services, which I think is needed. The patient centred approach, and the explicit recognition of the importance of patient’s voices are a huge benefit to any further policy discussions.

A good evening, and congratulations to the organisers.


Juggling and the older brain

If you know me, you will know that I am not the most dexterous person. I was never going to have a career as a surgeon. I read a paper some years ago that gave me hope that I might yet improve (not that I might take up surgery). I vaguely recollected that the authors had shown evidence of unexpected brain plasticity in older people, by documenting structural changes in the brain after teaching people how to juggle.

I was talking to a colleague from our Business School the other day, who, it turns out, is interested in brain plasticity, and functional MRI studies as part of her work in the Business School in DCU. I mentioned this memory to her, and she was very interested, so I went off to find the paper.

I did a little digging in PubMed, and eventually found two papers dealing with the impact of learning to juggle in older people.

The first looked at the effect of age on the ability of people to learn to juggle.

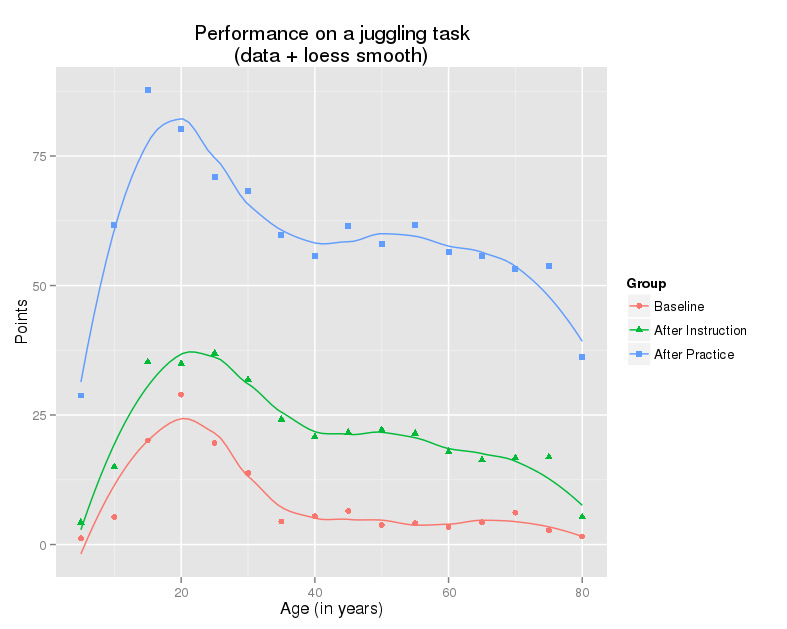
Performance on a juggling task

Performance on a juggling task by age, at baseline, after instruction and after practise. (Source – redrawn from Voelcker-Rehage C, Willimczik K, Motor plasticity in a juggling task in older adults-a developmental study. Age Ageing. 2006 Jul;35(4):422-7.PubMed PMID: 16690635.)

This graph shows the main results. There were over 900 people, across a wide range of ages (6 to 89). Each person was scored on video, doing a juggling task, first without instruction – ‘Baseline’, then after verbal instruction ‘After Instruction’, and then after 7 sessions of practise -‘After Practise’. The key finding was that, while people aged 15 to 29 did better than anyone else on this learning task, there was little indication of any further decline in performance with age.

The second paper compared MRI scans over 6 months of 69 older people (mean age 60) who were taught how to juggle. The first scan was a baseline, the second after three months, with (more or less) regular practise, and the third after a further three months, with no structured practise offered. They found that a particular area of the brain, known as the human middle temporal/V5 complex, which apparently plays a central role in the perception of visual motion, increased in size by 3 months into the study, and shrank back again by six months. There other changes in brain structure as well. These were similar to the changes they had found in a group of 20 year olds, in an earlier paper.

What does all this mean? From my perspective the most interesting finding of neuro-scientists over the last 20 years is that the human brain changes over time. Work on brain development in late adolescence and early adult life, has shown that ‘adult’ brain structure is not reached until the mid twenties. This capacity for development continues throughout life. This ties in with the evidence that learning can slow the development of Alzheimer’s disease – literally use it or lose it..

The work on juggling shows that we retain, into old age, the capacity to learn, and that this capacity does not decline much, if at all, with age. We have the capacity to change our brains as well as our minds.

Continue reading

Consultant salaries in Ireland – some evidence

There’s been a lot of discussion about public sector salaries over the last few days, and in particular about consultant salaries. A revised salary scale has been proposed for all newly appointed consultants, raising the starting and final salaries significantly. At the same time there are pre-budget murmurings about raising public sector salaries again. I am, of course, a public sector worker, so I am not entirely disinterested in this. My 2c are that if any public sector salaries are to rise, this rise should be confined to the lowest paid workers. People like me, on high salaries, ought not to be getting a sniff of a salary rise for several years to come.

Leaving that to one side, I want to look at the evidence on consultant salaries. I am a doctor, but I’m not a consultant. I’ve worked in hospitals for quite a few years, although not recently, and I spent a lot of time as a patient a few years back. I also work with quite a few consultants, and trainees (i.e. non-consultant hospital doctors) on various research projects.

The question being asked is simple enough. Are Irish consultants well paid, or poorly paid, by comparison with their peers? The context is two-fold; first, there is a really serious problem getting people to apply for and accept consultant posts in Irish hospitals; second, consultant salaries were cut quite sharply, like most other public sector salaries, between 2009 and 2013.

What is the evidence? The main source is the OECD Statistics database. The OECD collects a lot of information about various aspects of the health services in their member states, and they put a lot of effort into making these as comparable as possible. They collect information on the incomes of medical consultants (Health -> Health Care Resources -> Remuneration of health professionals). For Ireland, the OECD only collects information on the salary of consultants, not on their private earnings. These earnings are quite substantial, a point to which I will return. The OECD presents this information in a number of ways, each of which tells a slightly different story.

First a caveat, while the OECD does a lot of work to make these figures as reliable as possible, there are still big problems. All the data are averages, so you can’t compare pay-scales directly. The pension levy is not deducted from the Irish salaries, but it is definitely deducted from the take-home pay. The salaries exclude private practise income, which varies hugely. No data is collected on the up to 500 (or so) fully self-employed private consultants in Ireland. UK data may not properly account for merit awards. What is classified as a consultant in one place, is not necessarily a consultant elsewhere. In a word, these data are usable, but not necessarily always right.

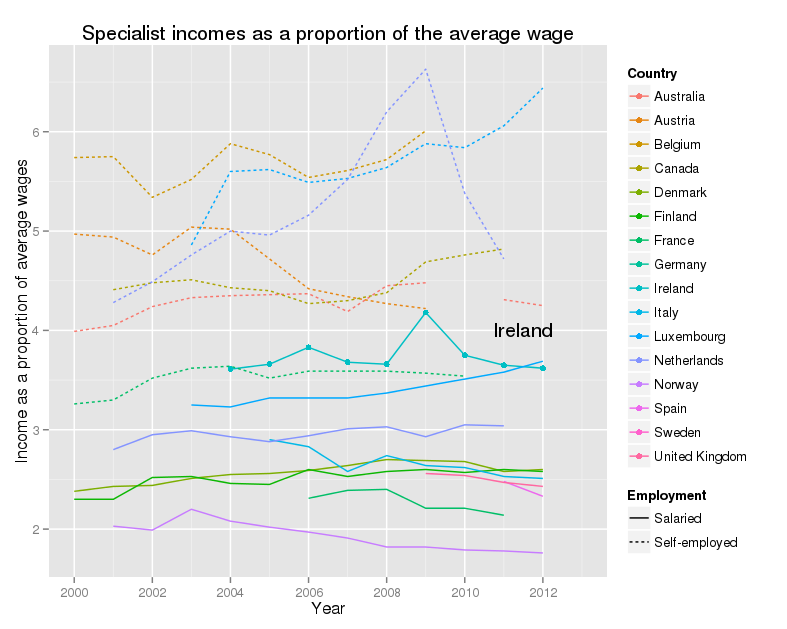
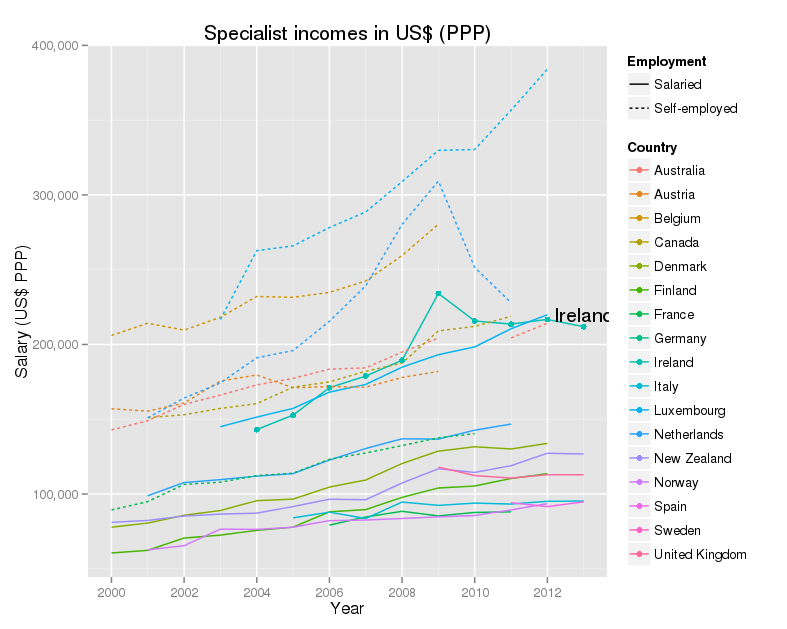
I’ve done a series of graphs, each of which I will discuss separately. In each of these graphs each country has a different colour. Those self-employed( dots) and those on salaries (solid line) are drawn with different types of line. Ireland is always shown as a solid line with large dots added, and this line is labelled as well.

Specialist incomes as a proportion of the average wage

Specialist incomes as a proportio of avergae wages - Data from OECD

This graph shows, for a wide range of OECD countries, the incomes for salaried and self-employed consultants, as a proportion of the average wage, from 2000 to 2012. For Ireland in 2012, this figure was 3.65, so in that year an average Irish consultant earned, from their salary alone, more than 3 and a half times as much as an average Irish worker. Irish consultants are towards the top of the salary scale. Their actual salary fell sharply, but so did everyone else’s, so the proportion is pretty flat. The other thing to notice is that self-employed consultants make far more money than salaried consultants. There are issues with accounting fully and properly for their costs in running the practise, but the overall message is pretty clear. Note that there are no data on private income for Ireland.

Specialist incomes in US$ at purchasing power parity

Specialist incomes in US$ PPPData from OECD

A different way of looking at the same figures is given by using a common currency. In this case the OECD use what are called “US dollars at purchasing power parity”. The idea is that money, even in a common currency, is worth less where the cost of living is high. OECD calculates a rough equivalent, between countries, and over time, for the amount of money that will buy an equivalent lifestyle, allowing for these varying costs. The story this graph tells is very similar. Irish consultants do well, coming at the top of the salaries with their colleagues in Luxembourg. Self-employed consultants do better.

Specialist incomes in Euro

Specialist incomes in Europe - Data from OECD

US dollars at purchasing power parity are all very well, but not exactly familiar. Euros are probably more useful for most of us. This graph shows the data for the Eurozone countries only. The picture is very similar to the previous graph.

What does all this tell us?

Allowing for the limitations of the data, I do not think that one can argue that Irish consultants are underpaid. I do think that they deserve high salaries – being a consultant is a tough job, with long hours and heavy responsibilities. Part of the confusion is that the salaries of Irish consultants are being compared with the incomes of self-employed consultants in other countries. Their salaries are notably lower than the incomes of self-employed consultants in other countries, but this is what you would expect.

What isn’t known, as far as I know, is the total income of Irish consultants. It is known that the private insurance companies pay about €360 million annually to the consultants, but, again as far as I know, there is no information on their office fee income, nor on the other costs that have to be met from this income (e.g. rent, office staff and so on), nor on how these fees are distributed (there is enormous variation in the private practise incomes of Irish consultants). It would be useful to have these figures.

The figures we do have suggest a need to ask a very serious question. Given that the salary covers only a proportion of the income of our consultants, how much should they receive, in total, as a fair compensation for their difficult and challenging work? I don’t have an answer for this, but I think that there is a real need for a careful, objective discussion of the topic. Consultant salaries are a sizable proportion of our total health expenditure, and we have to make sure that we are getting value from this spend.

My other question was “why is it so hard to recruit people for consultant posts in Irish hospitals?” As far as I know, no-one really knows, although there is a study going on at the moment. Pending the results of this work, there may be some clues in the latest Medical Council report on the medical workforce. Striking features are high rates of withdrawal from the register for younger doctors, and a very high proportion of doctors (1 in 3) who qualified outside Ireland. None of this suggests a service that is very attractive to its own.

Talking to colleagues over the last few years, the impression I have is that many people are unhappy about coming to work in Ireland. Some points people have made to me :-

  • Almost all consultants work very hard, and work very long hours
  • Most work significantly more than their contracted hours in the public sector
  • Our health system is complicated, with poor communications, mostly by mail, fax and telephone
  • Hospital bed utilization is extraordinarily high by international standards
  • Primary care is critically underfunded, so a great deal of that work lands back into the hospitals
  • Information systems are weak, and many processes are done manually, that have been automated in other countries for many years

Nonetheless salary cuts matter – I was enlightened by a colleague who drew my attention to the final report of the Strategic review of medical training and career structure. One of their recommendations (page 81) is :-

“The Working Group recommends that the relevant parties commence, as a matter of urgency, a focused, timetabled IR engagement of short duration to address the barrier caused by the variation in rates of remuneration between new entrant Consultants and their established peers that have emerged since 2012.”

I gather this was based on strong representations from trainees who met with the group, who intimated that the salary differential (of 30% between new entrants and existing staff) was the main factor, though by no means the only factor in their decision making.

So salary cuts do matter. It is possible that the new salary scales will produce the desired flood of people applying for posts in our services. I certainly hope so. However, I remain of the view that we need to fix many other issues in our services as well, if we are to keep these people working here, and have a decent and affordable service.

Acknowledgments

Colleagues, who had better remain anonymous, unless they wish to comment below, have very helpfully critiqued my observations. I appreciate this. I have a better grasp of the limits of the OECD data, and have found work on the attitudes of senior trainees to the lowered salaries for new entrants – their views were very negative. I was wrong to argue that salary cuts were relatively unimportant – they were (and are) important, but still not the whole story.

Appendix – specialist incomes and GDP/GNP

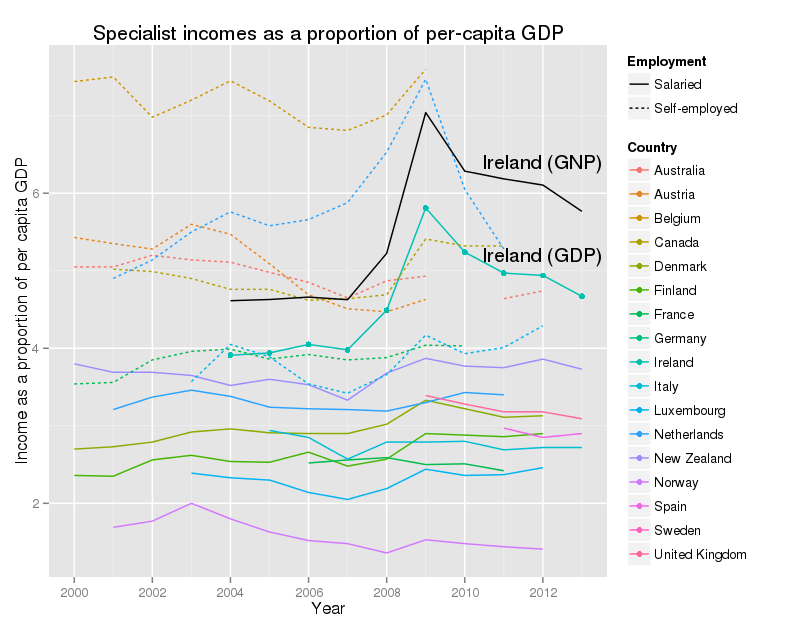
The OECD presents the earning figures in one further way, by comparison with GDP per capita. This is a very rough guide to the wealth of a country. Because Ireland is the home to a large number of multi-national companies, with very large exports, Irish GDP is not regarded as the best guide to the size of the economy. GNP is preferred. The CSO publish GDP:GNP ratios annually, and the latest published is for 2012. The ratio has fallen from about 0.85 in 2004 to 0.81 in 2012. I’ve assumed that the figure for 2013 will be similar. I’ve calculated the salaries of consultants as a share of the per-capita GNP, and added this to the graph.

Specialist incomes as a proportion of per-capita GDP - Data from OECD - Data for Ireland as a proportion of GNP added using CSO figures.

This shows a similar story to the other graphs, with one interesting twist. What is very noticeable is that Ireland is now much further up the rankings, both for GDP, and especially for GNP. This says, that relative to the wealth of the country, our consultants are well-paid. Again this excludes their private incomes. The peak in 2009 reflects the collapse in GNP, and not a rise in consultant salaries.

Technical note

The graphs are done in R using Hadley Wickham’s elegant ggplot2.

Colocation, colocation, colocation

Final decisions on the National Paediatric Hospital will be made shortly. One key element in the plan is colocation. What is it, and what are the implications of colocation for hospital site selection?

Colocation is the location on the same or adjacent sites of a children’s hospital, an adult hospital and a maternity hospital. There are several distinct types of colocation, with different objectives. To begin with I consider the likely effects of different types of colocation on patient care.

First, is colocation of paediatric services. The aim is to put all national tertiary paediatric services, and the secondary paediatric services for the Dublin region, on one site. At the moment these services are split across four sites, Crumlin, by far the largest site, Temple St, Tallaght, and Beaumont. There are several reasons why this is a good idea.

  • Managing the complex needs of very sick children demands close co-operation between many specialist doctors, nurses and other experts.
  • Requiring some staff to work across sites, imposes heavy travel time costs on them, and reduces the level of service they can provide.
  • There are significant economies of scale in providing access to costly technologies, for example MRI and PET scanners, the more complex laboratory facilities, and specialised theatre facilities.
  • Facilities with high throughput of patients are better for training more specialized clinical staff, and provide more opportunities for research.
  • Follow-up and rehabilitation care for recovering children often requires intermittent access to a wide range of specialists, which is easier to provide at a centre supporting a full range of services.
  • Provision of education and play for sick children, some of whom will spend many months, or even several years, on and off, in hospital.
  • Provision of both on-ward and off-ward accommodation for the parents of seriously ill children.

To achieve this any proposed site must have space for the full range of secondary and tertiary paediatric services. This is the case for most of the major international childrens’ hospitals.

Colocation of the children’s hospital and a major maternity hospital is also of great practical importance. The aim is to have immediate access to a full range of specialists, operating theatres and intensive care for the sickest newborn babies. This matters because, about one quarter of the children currently in the intensive care unit in Crumlin are newborn babies. Many of these high risk babies can now be identified before delivery. This allows the transfer of their mothers for delivery, which is much better for the baby than a long ride, late at night, in an ambulance. This colocation will support the future development of new specialised services, such as foetal surgery.

Colocation of an adult hospital and a maternity hospital has been less often discussed, but is also important. Every maternity hospital already has arrangements with local adult hospitals to support the care of pregnant women. Colocation makes these arrangements more substantial, and allows their wider development. A small number of pregnant women each year develop serious illnesses, beyond the capability of even a well-equipped maternity hospital. Equally, a small number of seriously ill women are also pregnant, and need the expert intervention of obstetricians and midwives to secure the best possible pregnancy outcomes. In both cases, this is best achieved by access to an onsite, or adjoining, adult hospital. The three big Dublin maternity hospitals are almost unique worldwide in not having such facilities.

Colocation of a childrens’ hospital and and adult hospital also has some clinical benefits. In the past, many of the more specialized paediatric services were provided by adult specialists who also did some paediatric work. This model of practice is passing, and almost all paediatric services are now provide by fully trained paediatric specialists. What is more relevant, is the transfer of care from paediatric services, to services for older adolescents and adults. This is facilitated by colocation, but only adolescents living in Dublin will benefit, as those living outside will have their care transferred to their local hospitals anyway.

Trilocation, that is the provision of maternity, paediatric, and acute adult hospital services on the same or adjacent sites is an ideal model. Most, but not all, of the large modern children’s hospitals that I have reviewed, are colocated with a maternity hospital, and a majority are colocated with an adult hospital. This model, if run well, provides the clinical benefits of the other types of colocation.

Besides the clinical benefits, better integration of management systems brings huge benefits. These include better efficiency, leading to lower costs, and better operational performance, leading to better outcomes. Many of these improvements do not require colocation, but all will be facilitated by it. These include common governance and audit systems, common infection control, common purchasing and personnel systems, common laboratory, imaging and IT facilities, more effective staff management, and better accountability for service delivery. Arguably, if colocation is to succeed, setting up this integration ought to precede the design and build of the new hospital buildings. Indeed, it would be fair to criticize the existing National Paediatric Hospital board, for their failure to begin doing this.

A further advantage of a single paediatric facility is in building up the scale and scope of both research, and training. The existing hospitals have modest, and moderately successful, research units. This division of a limited capacity across three sites seriously impedes Irish research into childhood disease. Horizon 2020, the next EU funding scheme for research has great opportunities for Ireland. Other countries have built major clinical and biological research centres, which are major employers. To do this, we would need a critical mass of researchers, doctors, nurses and patients. The NPH, on a single site, beside a research active adult hospital, would be a great start. Training is also inhibited by the the fragmented paediatric services. Ireland does not have the resources to provide advanced training in the care of sick children in three places. Again, a single hospital will greatly improve our capacity to offer advanced training to the next generation of doctors, nurses, and other child health professionals. Co-location with maternity and/or adult hospitals will provide further benefits in training and research.

Any proposed site for the new hospital needs to have the space to include all of these elements. A single acute inpatient facility for the children of Dublin, and a single tertiary centre for the children of Ireland, ought both to be non-negotiable. In my view, the next requirement is a colocated maternity hospital. Given the fiscal realities of Ireland today, this means one of the three Dublin maternity hospitals, based on its present site. It is nice to dream of shiny new maternity hospitals on green field sites, but its not going to happen. The very sickest babies in Ireland ought to be spared long ambulance transfers wherever possible. An acute adult hospital, either on site, or adjoining is also very desirable. Finally any site must have space for expansion. New buildings will be needed. Old buildings will need to be refurbished. Doing this essential work on a cramped site raises costs and increases the risks to children.

We can built a really good facility for Irish children, for Irish mothers and for Irish adolescents. We need less territoriality, less spin, and more focus on the actual needs of sick children and their families. We need the integration of management systems, and boards, to begin as soon as the constituent bits are identified. We need all of this in the next few weeks. Will we get it? Watch this space…

The UK Quality and Outcomes Framework for NHS GPs – Did it work, and should we copy it?

Quality and Outcomes Framework – summary report of a meeting held by the primary care research groups of the Royal Statistical society (RSS) meeting Monday 21st November, Errol St. London.

Speakers

  • Nick Steel
  • David Reeves
  • Tim Doran

What I report here is my interpretation of what the speakers said combined with the audience discussion afterwards. The speakers are not responsible for anything they disagree with!

Background

The Quality and Outcomes Framework (QOF) is a system of payments to British GPs introduced in April 2004. In brief, GPs have a set of targets, mostly oriented towards certain chronic diseases, and they receive substantial payments for hitting these targets for a high proportion of relevant patients. There is evidence supporting the benefit of hitting each of these targets. The relevant patients are declared by each practice on a series of practice registers, for example one for people with diabetes, one for people with known heart disease, and so on.

For example, a GP practice would register patients at risk of coronary heart disease. If a recent blood pressure (within the last 15 months) is under 150/90 a patient has met that target. A GP where less than 40% of the relevant patients meet the target gets nothing. A GP where 70% of the relevant patients have met the target gets 30 points, and there is a sliding scale between these points.

The QOF contains four main components, known as domains. The four domains are: Clinical Domain, Organisational Domain, Patient Experience Domain and Additional Services Domain. Each domain consists of a set of achievement measures, known as indicators, against which practices score points according to their level of achievement. The 2010/11 QOF measured achievement against 134 indicators; practices scored points on the basis of achievement against each indicator, up to a maximum of 1,000 points.

  • clinical care: the domain consists of 86 indicators across 20 clinical areas (e.g. coronary heart disease, heart failure, hypertension) worth up to a maximum of 697 points.
  • organisational: the domain consists of 36 indicators (worth up to 167.5 points) across five organisational areas – records and information; information for patients; education and training; practice management and medicines management.
  • patient experience: the domain consists of three indicators (worth up to 91.5 points) that relate to length of consultations and to patient experience of access to GPs.
  • additional services: the domain consists of nine indicators across four service areas – cervical screening, child health surveillance, maternity service and contraceptive services.

The QOF gives an indication of the overall achievement of a surgery through a points system. Practices aim to deliver high quality care across a range of areas for which they score points. Put simply, the higher the score, the higher the financial reward for the practice. The final payment is adjusted to take account of surgery workload and the prevalence of chronic conditions in the practice’s local area (Source http://www.qof.ic.nhs.uk/). A practice getting maximum points across all targets gets about £ST130,000 extra a year. QOF payments come to GP practices through the Primary Care Trust with which they are affiliated. Overall the QOF costs about £ST1 billion a year.

The targets are measured as reported by the GPs from their IT systems. The PCTs do not have direct access to these, but an abstract is supplied to the PCTs by each practice.

Evaluations

The QOF was introduced in a big bang across the whole of the UK in April 2004. This was at the insistence of the BMA, who opposed a phased roll out. No baseline data were collected beforehand. In particular, no data on the proportion of GP practices meeting the various targets before the QOF started were collected. This was because of political pressure to do something fast about General Practice. The result was that no assessment was done of the QOF. A number of studies have now been done with ambivalent results. These were done using synthetic indicators made from existing GP data gathered for research purposes, for example, the GP Research Database. These show significant improvement in the indicators over time, but little evidence for most indicators, that the rate of improvement sped up when the QOF was introduced. There are indicators which rose faster in the first year of the QOF, but returned to the earlier trend of improvement from the second year on. An extensive systematic review of the QOF will be published in the next few weeks, and these results are from a preview given by one of the authors.
Pay-for-performance, and the cost-effectiveness of the QOF

The OQF is a pay-for-performance system. The research evidence on these systems is that they benefit productivity if the work being done is mechanical and repetitive. If the work involves even rudimentary cognition pay-for-performance does not work. There are case studies from Maine in the USA, where strict targets for diabetes care were set, and primary care doctors got a small sum of money ($10) for hitting these. This was modestly effective. Overall QOF has reduced inequalities in the indicators measured between practices in poor, middle income, and rich areas, but there is little evidence of markedly improved health for a very large investment. Nurses generally like it because it has improved their working patterns, and expanded their practice. Doctors tolerate it, claim not to like it, but feel that it has improved practice.

Issues

There is extensive gaming of the QOF. Most PCTs do not police it with any rigour. This is partly because to do so requires significant skills, and partly because they do not want to rock the boat. The major games relate to minor shading of results, for example the hypertension target is under 150/90, which is not exactly demanding. There seem to be quite a few patients coming ins at 148/88 and similar values.

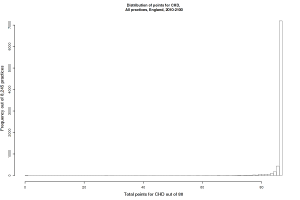
The targets are not very tough (See Figure 1)! Most practices get maximum marks. There are a few exceptions, for example university student practices, where there are so few people with chronic diseases that it is nearly impossible to get a high score. This is dealt with by local informal special funding arrangements. The targets were originally set with no baseline data, so the maximum and minimum cut-offs were largely made up.

There is a practice called exception reporting. This allows a GP to declare that specific patients, for stated reasons, will not be counted. A good example is the use of beta-blockers after a heart attack. For some patients these are not advised because the patient has a condition which would be worsened by the drug, so these patients are ‘exception reported’ from the heart attack register. However, there is evidence that many practices use exception reporting to game the system, and that practices with high rates of exception reporting are likely to be of poor quality overall.

The targets have been revised somewhat since they were set up, but the targets for maximum payment have hardly been shifted at all, even though most practices are hitting these. A proposal that these targets should be reset to the 75th centile (the cut-off between the top quarter of practices, and the bottom three quarters), was rejected.

There is modest evidence that treatments and patients with diseases which were not incentivised by the QOF scheme have suffered.

Mental health is not covered by QOF at all, partly because it was too hard to come up with indicators.

Advice

The question of whether the speakers would recommend other countries to introduce the QOF was extensively discussed at the meeting. The final answer was ‘Yes-ish’. The recommendations below are what I would recommend before thinking about a QOF for Ireland.

  • Establish baseline values for any proposed indicators for a year or two before introducing anything.
  • Extract data directly from the GP EHR systems, with no practice-level intervention.
  • Monitor patterns of care closely.
  • Allow exception reporting, but monitor it closely.
  • Prohibit dumping difficult patients (which is common in the USA).
  • Set tough targets, based on evidence.
  • Possibly give full payment only for 100% compliance with the target, or for a 75th centile performance, revised each year.
  • Revise these targets regularly
  • Look at the Kaiser system, where practices are evaluated on targets, but do not know till the end of the relevant year what those targets were. This makes gaming pointless, and encourages a wide view of practice improvement

Scandal Exposed in Major Study of Autism and Mercury – Not!

Irish Autism Action pointed me to a piece picked up by Yahoo news from October 25th, written by staff from the Coalition for Mercury-Free Drugs (CoMeD) . It is a critique of sorts, of a paper published in Pediatrics, in 2003, on “Thimerosal and the Occurrence of Autism: Negative Ecological Evidence from Danish Population-Based Data” which may be read (free, thanks to the AAP) here.

The paper first.

It is written by seven Danish scientists. Poul Thorsen, of whom more later, is the fourth author. To understand the importance of this paper, you need to know that Denmark has one of the best health information systems in the world. The vast majority of contacts between Danish residents and their health services are recorded, with a unique identifier, which allows one to identify the first contact, and to avoid counting the same people twice. This system is reliable, not infallible, but far better than equivalent systems in the UK. There are no such systems in Ireland.

Thiomersal or Thimerosal

Thimerosal or Thiomersal is a chemical, containing mercury. In the body it is converted to ethylmercury. A lot is known about the toxicity of a related compound, methylmercury, which caused the terrible tragedy of Minanmata disease. Much less is known about the toxicity of ethylmercury, but it is felt to be wise to assume that it too is toxic. Thiomersal has been used as a preservative in multi-dose vaccine vials for many years, but, because of concerns about possible toxicity, is now largely phased out in the EU, and the USA. There has been an extensive controversy about the links between thiomersal exposure in infancy and childhood, and the development of childhood autism.

What the Danish paper adds

The Danes analyzed first diagnoses of autism, (the ‘incidence’ of autism in the jargon of my profession), in children, aged between 2 and 10, and diagnosed between 1971 and 2000. Thiomersal was used as a vaccine preservative up to March 1992. They found just under 1000 cases of autism diagnosed in Denmark over this period. The rate of occurrence of autism is shown in Figure 1 from their paper.
Figure 1 for Madsen's paper form Pediatrics

Briefly this shows autism rates low, and steady from 1971 to about 1987 or 1988. After this autism rates rise steadily, first in the youngest children (ages 2 to 4), then in the next group (ages 5 to 6), and finally in the oldest children, (ages 7 to 9). These are children newly diagnosed with autism. Rates are beginning to dip in the two older groups in 2000, as compared with 1999. The vertical line on the graph, in 1992, shows when thimerosal containing vaccines stopped being produced in Denmark.

What does this mean?

This graph shows a significant increase in the incidence of autism. This is similar to that recorded in many other countries at the same time. No-one really knows the cause of this increase. It is widely believed by experts that a big part of it is due to a mix of better access to child psychiatric services, better and more rigorous diagnosis, and to the broadening of autism diagnoses into the Autism Spectrum disorders (see the recent review by Fombonne). This does not mean that some part of the increase may not be real, but it is widely believed that most of it reflects other things besides a real increase in autism.

There are also specific factors which very likely contributed to the rise in Denmark – and are mentioned in their paper. First they moved classification systems, for autism, and all other diagnoses, in 1994, from ICD-8 to ICD-9. Secondly, outpatient diagnoses were accepted from 1995, but the authors examined inpatient diagnoses separately, and found the same pattern in these data. They did not show the inpatient only data, but this is a common practice, enforced by editors, when there is pressure on space in published papers.

It’s easier to say what this does not mean. If you believe that thiomersal in vaccines caused any significant proportion of cases of autism, you should no longer believe this. I can think of no mechanism by which removing a major cause of autism, could lead to a rise in the incidence of the syndrome. The dip in incidence in 2000 is interesting, though modest, but cannot be related to the removal of mercury from vaccines eight years earlier.

And the scandal?

The COMED story makes two specific allegations

  • The authors suppressed data from 2001, which showed a further fall in autism prevalence. CDC officials knew about this.
  • One of the authors, Poul Thorsen, has been sacked by his employers, Aarhus university, and is under investigation for large scale financial fraud against the US government, related to grants for autism research.

So, let’s take these in order.

Suppressing data?

First, the fall in autism incidence in 2001. As I mentioned the paper shows data up to 2000, with some indication that incidence is falling in 2000 compared with 1999. The email mentioning the 2001 data is largely redacted, so it’s hard to make much sense out of it. But if we suppose that the rate had indeed fallen further, what implication does this have for the published paper? The paper shows clearly a large increase in autism incidence starting a few years before thimerosal was removed in 1992, and continuing at the same pace for at least six further years (up to 1999). Removing thimerosal in 1992 cannot affect autism rates in children aged 5 to 6 in 2000, it is simply impossible. Neither can it affect rates in 2001.

Many scientists in my discipline struggle with the ‘just one more year’ problem. Data are seldom complete on December 31st. It takes time to clean data, to check it, and to make it available. It then takes more time to get it, analyze it, and write a paper about it. By then the next year’s data may have come out. Most of us decide, usually after a quick look at the new data, if we want to hold up the paper for another six months while we repeat the process. At some point, you just have to publish. This is life, not a scandal!

Poul Thorsen

First, a declaration. I know Dr. Thorsen. I have met him two or three times, when I was working on a study to design methods to estimate the prevalence of autism across Europe. If, as alleged, he has defrauded scientific funds paid by the US, to Aarhus university for autism research, I do not defend him. However, even if every charge in the grand jury indictment were proved, I do not see that this ought to affect how we read the paper.

Thorsen was one of seven authors, and was neither the first, nor the last, the two most significant slots in our business. The paper was not funded by his research funds, and had no organic connection with them. No allegation of scientific fraud has been made against him. An ancient, and disreputable debating strategy is the ‘ad hominem’ attack – I can’t attack what you say, so instead I will attack you. Scientists didn’t attack Andrew Wakefield personally, they attacked his paper, because the conclusions he presented, did not follow from the evidence he presented. Similarly, an attack on Poul Thorsen, justified, or otherwise, does not speak to the correctness, or otherwise, of this paper.

One swallow does not a summer make

One of the mottoes of my profession is ‘Never believe one study’. Any single study can come up with a completely wrong answer, no matter how well it is done, no matter how skilled, conscientious, and honest, those who work on it. In the case of thiomersal and autism, there is a small flock of good studies, all saying pretty much the same thing – there is no evidence for a causal link between autism and thiomersal exposure. The paper by Madsen et al. is only one of the flock, but it is flying in the same direction as the others.

Is thiomersal safe?

Many countries still need to use thiomersal, because it is cheap, effective, and allows vaccines to be used safely in hot climates. We don’t use it, because we can afford not to. José G. Dórea, from the Universidade de Brasilia in Brazil, has a very thoughtful review article assessing the evidence, and concludes that, if we have to use it, and Brazil does, we need to be very careful with thiomersal in babies. He finds no good evidence of harm, but this not the same as evidence of safety. If thiomersal has to be used, there are steps that can be taken to protect and develop babies’ brains in other ways, and these ought to be adopted widely in any event. I would fully agree with him.

Scandal?

I do not speak for the Coalition for Mercury-Free Drugs, and I make no assertion about their objectives in writing this story. However, they are wrong. There is no scandal here, and the problems they identify with the paper are acknowledged and addressed by the authors. There is a
long report, sent by CoMED, to Béatrice Sloth of the Secretariat for the Danish Committees on Scientific Dishonesty, which forms, I think, the basis for the press release. I have read it carefully, and I see no evidence of scientific wrong-doing in the report. There are critcisms of the paper, but the major scientific issues raised, the change in diagnosis codes, and the inclusion of outpatient care, are addressed in the paper by the authors. This is not stated in the report.

All in all, this is a non-story. It is typical of too many others, written by people who seem to only half understand the science, and seemingly intended to strike fear into the hearts of parents. Some children died, and many more were unnecessarily brain damaged, by the original measles vaccine scare. Is that not enough? Isn’t it time to stop?
Implementing Social Health Insurance in Ireland

This opinion piece was published in the Irish Times on Tuesday 12th February 2011.

Implementing Social Health Insurance in Ireland, a report of the workshop held on December 6th, 2010, will be published today by DCU. The report is edited by Prof Anthony Staines of the school of nursing in DCU which sponsored the workshop. Participants included Prof Peter Groenewegen of Nivel, the Netherlands Institute for Health Services Research; Prof Orla Hardiman of Beaumont Hospital; Dr Martin White of Nobber General Practice; Dr Steven Thomas of Trinity College Dublin; Dr Gerard Crotty from Tullamore; as well as Dr Davida De La Harpe, FPHM; Dr Michael Drumm, MMUH; Dr Maire O’Connor, FPHM; Dr Susan Smith, Inchicore Medical Centre; Dr Mary Rose Sweeney, DCU; and others

It seems likely the next government will be made up of Fine Gael and Labour. Both propose extensive changes to the health service and both propose to introduce universal health insurance.

Last weekend, Fine Gael published a detailed policy proposing to introduce a social health insurance scheme, modelled roughly on the system in the Netherlands. Labour has yet to publish its detailed policies.

In the Netherlands everyone is required to have health insurance, with the premium paid, or subsidised, by the state for people on low incomes. This provides free access on equal terms to primary care, ie GPs and related services, to prescriptions, to mental health services and to hospital care.

Like our own health insurers, they apply community rating, but unlike ours, they have a working system of risk equalisation. Long-term care is funded separately from other health services.

Can we really implement a social health insurance system in Ireland? A group of national and international experts, clinicians, managers, policy makers and others met in Dublin just before Christmas to consider this question. Some basic principles of care delivery were brought out at the conference.

Care needs to be patient centred, not determined by the needs of the institutions. Access to care must not depend on patients’ resources. A system which places a high priority on equity and social solidarity can be built and can be delivered within the existing budget. Such a system must have accountability, visibility of outcomes, resources and activity.

The first source of concern is the miserable track record of both the Health Service Executive (HSE) and the Department of Health in effecting change. Although there are some recent successes, most notably the partial reorganisation of cancer services, there are a lot more failures. Overcoming this will need political, managerial and clinical leadership, as well as substantial training and support for staff.

The leadership exists within HSE. Will it come out? Will managers and clinicians line up behind the sort of radical reform that is needed? The view of those of us who met before Christmas is that clinical leadership is essential, and will be forthcoming.

In primary care, including general practice, the main obstacle is overcoming decades of underinvestment without spending much money. It is possible to build up primary care relatively cheaply. There are large resources spent in the sector, but there is an absence of co-ordination between different professionals.

Providing shared spaces, meetings and common record systems will cost little, and should be helpful. Moving away from the present highly centralised model of primary care development, acknowledging that the best ideas for primary care development in each area will come from the people working there and supporting a more organic model of service development, more attuned to local needs, will help. This is all quite possible.

The acute hospital sector is of very variable quality and it is impossible to make any reasoned assessment of the performance of these organisations. Maurice Hayes’s recent report on Tallaght hospital, allegedly one of the better run facilities, does not make for comforting reading.

It ought to be possible to save money and get a more intelligent use of resources by merging hospitals into groups with a common management. The first steps on this path have already been taken. A much wider use of shared services is also essential, with, for example, a common purchasing agency for the whole sector.

It will be much harder to get the hospitals to refocus on servicing primary care. To take one example, there are several huge clinics for treating diabetes in Irish hospitals. These are very costly and most of these patients ought to be fully managed in general practice. There are a number of other examples of this kind of pointless gigantism. A revised hospital system would have many staff, doctors, nurses and others, who spent most of their time off the premises.

Long-term care is also a challenge. The question is: “Whose interests will prevail: those of the clients, or those of the institutions which seek to provide care for them?” At the moment the institutions are winning. It’s not at all clear that the Fair Deal nursing home funding policy is economically sustainable.

The nursing home sector grew rapidly, and in a completely unplanned way, thanks to careless tax breaks. It’s not clear that it meets the needs, or the reasonable desires, of elderly people to remain living in their own homes. The budget for home care for the frail elderly is under threat and this may lead to people being bumped into nursing homes who do not need to be there and do not wish to be there.

The same issue affects people with disabilities. A more reasonable model for both groups is to provide them with individual budgets and let them source the care they need, using their own judgement.

The final pieces of the jigsaw are the insurance companies and their regulators. It’s very doubtful if any of the current crop of health insurers have the skills and the capacity to take on the task of running a social health insurance system. The demands on the insurers are much tougher than in our current system, and so the new insurer will cost a lot more to run. In fact, it’s questionable whether there is room for more than one such insurance company in a small country of only 4.5 million people.

Equally, the regulator will need to change its role. Without very tight regulation, and very tough enforcement, a social health insurance system will fail.

A key question is who controls the basic package of services? This is the core compulsory insurance and will be the only cover held by most people. As such it is essential that it provides enough cover; that the quality of the care provided is closely monitored; and that the outcomes of care and other quality measures are made public.

To support all this, Ireland will need a modern health information infrastructure. There are several successful models of this, for example the free open-source Vista system used by the American Veterans’ Administration. Such a system could be in place in three to four years. It would both improve productivity in the system and provide the infrastructure for the health regulator to do its job.

All of this depends on leadership. Without political leadership, nothing at all will happen. Without leadership from clinicians (doctors, nurses and others), what happens will not work. Without leadership from managers in HSE and the Civil Service, what happens will not be sustainable.

Our view is that, if the necessary training and support are provided, Ireland could have a working social health insurance scheme in five years’ time. What are we waiting for?

More detail of our report, and a number of useful resources are found elsewhere on this website.

Time to Move on from Congregated Settings: A Strategy for Inclusion

“Congregated settings” is the jargon term used in our health services to describe facilities where more than ten disabled people live. They range in size from ten up to several hundred, and, apparently, from excellent to very poor. In 2007 HSE set up a “Working Group on Congregated Settings” to ‘develop a national plan and change programme for transferring people with disabilities living in institutions into the community’ (Dail records – John Maloney 6th July 2010 in answer to Phil Hogan).
On July 12th 2010, under the headline “Institutions for disabled should be closed down, says report”, Carl O’Brien of the Irish Times, wrote :-
“ALL INSTITUTIONS for people with intellectual disabilities should be closed down within the next seven years because they are in breach of residents’ basic rights.
That is the main conclusion of an unpublished report by the working group established by the Health Service Executive (HSE) to examine conditions in “congregated settings”, or institutions with 10 residents or more.
The 72 institutions, which cost the State just under €500 million each year, accommodate some 4,000 people. Most are run by voluntary organisations and religious groups. The report recommends replacing them with supported or independent placements in the community.
The report, which is expected to be published in the coming months, found major variations in the cost of care across the congregated settings it surveyed. The average cost per resident was €115,000 a year, while costs ranged between €46,000 and €385,500 per resident in different units.”
The large charities providing services, and HSE, seem to have adopted a pre-emptive strategy. They will build lots of housing for people with disabilities, and fill it with their own long-term residents. This secures the long-term viability of the services, and will, I am sure, improve the conditions for the residents. However, is it what the residents want? Has anyone asked them?
Noelin Fox (a PhD student in Galway, writes “Are we creating new institutions for people with disabilities?” Based on an analysis of our obligations under the UN Convention on the Rights of Persons with Disabilities, Fox argues that parking large numbers of disabled people in campus settings is simply inadequate. It is hard to disagree.
This policy response is proceeding, largely using taxpayers funds, but there does not seem to have been any published economic, or human rights, evaluation of the new developments. It’s not known whether the report, apparently entitled “Time to Move on from Congregated Settings: A Strategy for Inclusion” has done such an evaluation, but they have considered campus settings, as well as dormitory settings in their work.
What is driving the large service providers? It’s possible that they are running scared of the idea of individual budgeting. This strategy would do away with the current focus on large line budgets for single institutions, replacing these with an individual budget held by the disabled individual, or their guardian where necessary. These individual budgets would be used to provide whatever services the disabled person chooses to help them live their own lives. Budgets would be set annually on the basis of an individual needs assessment for the client, rather than the current very cumbersome, and costly, clinical assessments. The implications of this for the existing large scale disability services are profound. They would need to reconfigure very extensively just to survive. However, a large number of new jobs would be created, so the state might get much better value for the same money.
The report remains closely held three weeks before the election. One wonders why?

Home care for the elderly

I’ve just finished watching the PrimeTime program on home care for the elderly. In summary, a number of not-for-profit and for-profit home care providers are using untrained staff, breaching various acknowledged standards, managing care staff very poorly, and generally providing crummy care to some of the most vulnerable people in society.

A nice man, Noel Mulvihill, assistant national director for older care indicates that he will write to his staff to instruct them to monitor the quality of the care they are paying many tens of millions a year for. One wonders what, exactly, Mr Mulvihill and his colleagues have been doing for the last few years. In fairness to them, they have been working hard on standards for residential home care, but I do feel that HSE ought to have considered home care quality too. If you wonder why they have concentrated on nursing home care, try looking up Lea’s Cross on Google.

Even more worrying, Deputy Aine Brady, Minister for Older People, was interviewed. She did not seem very perturbed, at the findings of the report, and expressed doubt about the need for more regulation in the sector. She is one of our hereditary TDs, the daughter of one TD, sister of two others, and married to a fourth.

Kate Hartigan, another assistant national director in HSE, was interviewed after the program on Pat Kenny’s show. She is talking about future regulation, building on their work on defining care packages. They have taken some steps to deal with the companies covered by the program, but it would seem little more has been done. Sara Burke did a nice hatchet job on the staggeringly incoherent policy which has lead us to this mess. The goal of the policy was to drive down the costs, and this has worked. The quality has not been assessed yet. There is still a large amount of variation between counties in service provision.

Can we change this? It will cost money to do it.