Graphs of OECD data
These notes are mainly to remind me how to draw graphs which use OECD data on health outcomes, health care expenditure. like this one :-
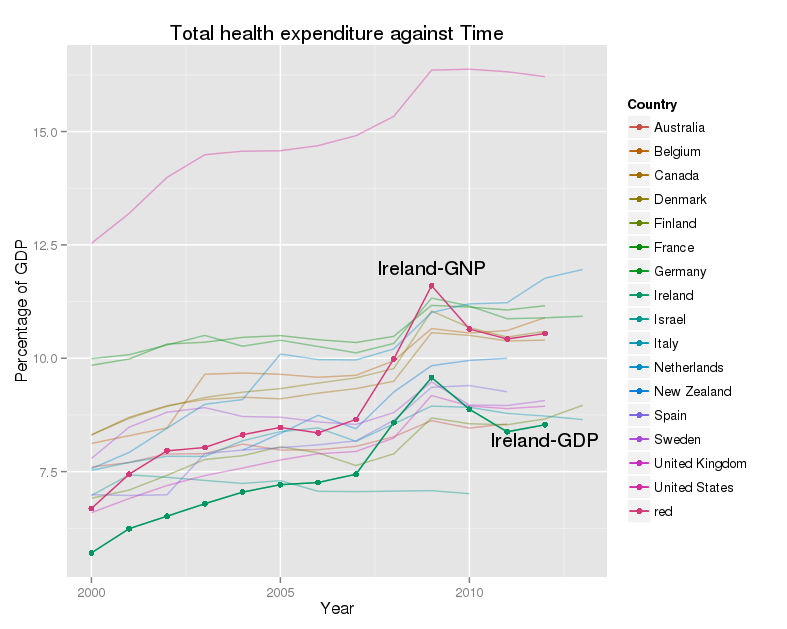
- OECD data on total health care expenditure as a percentage of GDP by year across a selection of countries
The data come from the OECD stats library, which still requires a subscription. You can download data in several formats. These include Excel files, and compressed comma separated variable (CSV) files. The Excel files use ‘..’ as a missing value character, and need a bit of work to remove formatting, empty columns and rows, and the like before use. The CSV files are compressed with gzip, and I’ve found problems uncompressing them on Linux. The code below seems to work though.
gzip -dfc OECDdata.csv.gz > OECDdata.csv
I use RStudio, and usually use knitr. The libraries I load are here :-
Load necessary libraries

```{r}

library(ggplot2)

library(reshape2)

library(stringr)

library(plyr)

library(scales)

```
OECD data come in wide format, with each year's data in one column, and the variables which explain it are lined up in columns beside the years like this :-

 "Country","Unit","2000","2001","2002","2003","2004","2005","2006","2007","2008","2009","2010","2011","2012","2013"
 "Australia","% gross domestic product",7.6015,7.7003,7.8903,7.8959,8.1065,7.975,7.9824,8.0563,8.2678,8.6248,8.4604,8.5505,"NA","NA"
 "Austria","% gross domestic product",9.4401,9.548,9.6235,9.7954,9.9059,9.8669,9.7359,9.7435,9.9469,10.5356,10.4834,10.2371,10.4102,"NA"
 "Belgium","% gross domestic product",8.1206,8.2921,8.4618,9.6474,9.6751,9.6472,9.5809,9.6237,9.9428,10.6547,10.5577,10.6107,10.8944,"NA"
There are 35 rows, and 16 columns in this particular file. This format is not well suited to graphing, so I need to melt it.
#Total current expenditure as a % of GDP

TCE TCEm variable.name='Year')

#Changes values of year from X2000, X2001 etc to 2000, 2001 and so on.

TCEm$Year
What does this do? The final result looks like this :-

 "","Country","Unit","Year","value"
 "1","Australia","% gross domestic product",2000,7.6015
 "2","Austria","% gross domestic product",2000,9.4401
 "3","Belgium","% gross domestic product",2000,8.1206
 "4","Canada","% gross domestic product",2000,8.3075
There is one row for each combination of the two id variable ‘Country’ and ‘Unit’ data point. Each row in the original data set leads to 14 rows, one for every year, in the molten data set.
To make this picture I used this code:-

 # Total current expenditure as a percentage of GDP by year
 g geom_line(aes(x=Year,y=value, group=Country,colour=Country),alpha=0.4) +
 geom_line(data = subset(TCEm,TCEm$Country %in% Ireland),
 aes(x=Year,y=value, group=Country,colour=Country)) +
 geom_point(data = subset(TCEm,TCEm$Country %in% Ireland),
 aes(x=Year,y=value, group=Country,colour=Country)) +
 geom_line(data = IrelandAdjTCEm,
 aes(x=Year,y=value.x.revised, group=Country,colour='red')) +
 geom_point(data = IrelandAdjTCEm,aes(x=Year,y=value.x.revised, group=Country,colour='red')) +
 xlab("Year")+ylab("Percentage of GDP") +
 ggtitle("Total health expenditure against Time")+ scale_colour_hue(c=100,l=50) +
 annotate('text',x=2009,y=12,label="Ireland-GNP") +
 annotate('text',x=2012,y=8.2,label="Ireland-GDP")
 g
 ggsave("TCE.png",plot=g,width=20,height=16,dpi=100,units="cm")