Ageing and Ireland

I was asked to speak earlier this year at a seminar on ‘Co-op Care – Co-operatives and elder care in Ireland’, organised by the Society for Co-operative Studies in Ireland. I’ve now had the opportunity to put these materials up,   together with the original presentation.

There has been  lot of concern about the impact on Ireland of our ageing population. Some concern is warranted – there will be more older people in Ireland than there are now, both in absolute numbers, and as a proportion of the whole population. This fact needs to be accommodated in planning and budgeting for both the short, and the long, term.

There is good evidence that this shift in demography can be easily accommodated in Ireland – primarily because our EU peers are well ahead of us in having ageing populations, and they seem to be doing just fine. This didn’t happen by accident, but by detailed, careful, planning and working with older people to ensure that their needs were met, and their choices accommodated.

Demographics

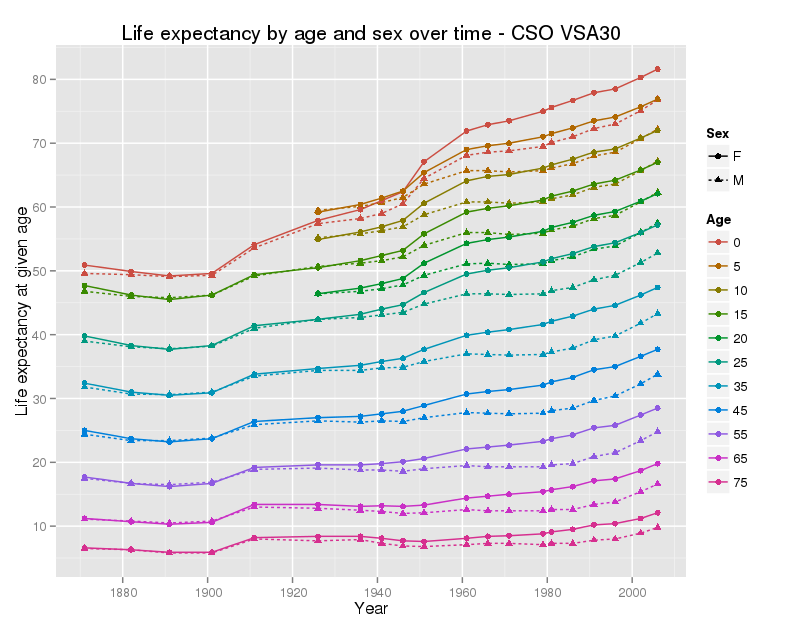
The number of older people in Ireland is rising, and rising fairly fast. This is for a really good reason – life expectancy is rising steadily, and continues to rise.

VSA30

The implication is that the proportion of older people will rise too. However this also depends on the number of births. Ireland has and maintains a relatively high birthrate. There is a measure – the ‘Old Age Dependency Ratio’, which reflects the number of older people per working age person in the economy. To be exact, it is the number of people aged 65 and over, divided by the number of people aged 15 to 64 (and multiplied by a hundred). The next graph shows this for a set of OECD member states.

OADR
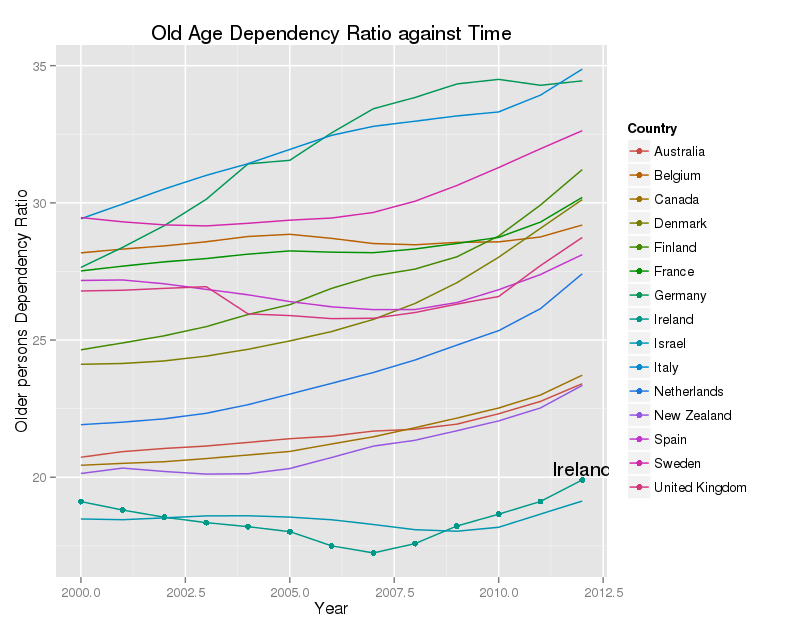
Ireland has one of the lowest OADR in the whole EU, and while it is rising, it is nowhere near that in most of our peers. The number of older people is rising, but there are many more younger people, partly as a result of immigration, and partly as a result of historically high fertility rates. The OADR will rise, and will rise quite quickly in Ireland. The CSO predict that it will be about 30 by 2031, and about 40 by 2046. This will be a real challenge to us, but nothing that most of the rest of the EU has not already faced.

Health, and death

It’s a commonplace phrase that 70 is the new 50, but it conceals a real truth. Although people are living longer, they are also staying healthy for longer. In the 1920’s a man of sixty-five was old, and was likely to be frail. This is no longer true. The inelegant phrase used to describe this is ‘compression of morbidity’. Most people are reasonably well until the last year or two of their lives, and this has not changed, although the last year may occur now in their eighties, and not their sixties.

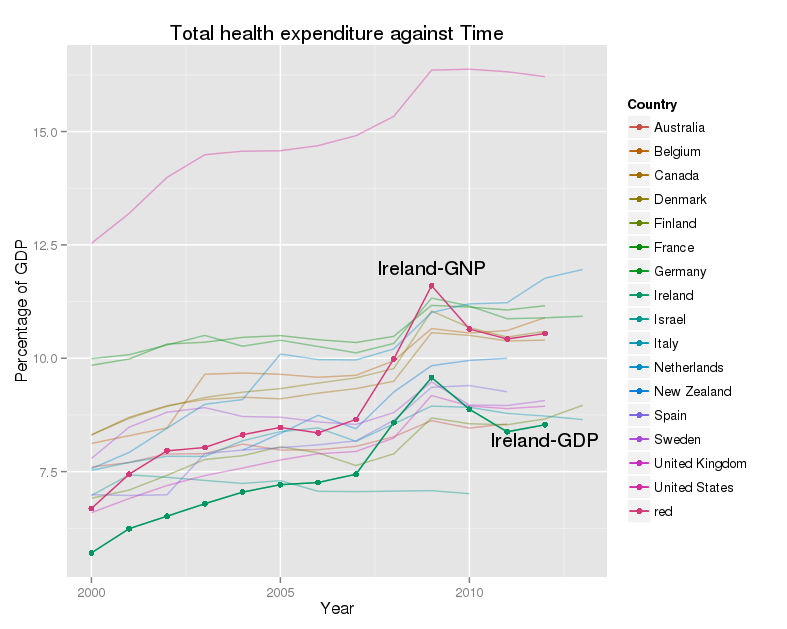
The main users of health care and social care are older people shortly before they die, and a group of people, across a wide span of ages, who are affected by more than one long-term illness – which is referred to as ‘multimorbidity’. The implication is that this is the group for whom our health services needs to work best. There is reasonable evidence that a combination of well-organised primary care, active intervention to maintain health, mobility, and maximal independence, and support for self-care, can improve the quality of life for this group of people, and reduce health care costs.

Responses

There are two responses to the issues described here. The first is to seek to induce panic – essentially arguing that this cannot be afforded, and that social and health care need to sharply pruned if the economy is to survive. This is not true – a detailed analysis is given by Bloom et al, in the Lancet paper listed below.

The more constructive response is to decide to cope with the issue. This is eminently feasible, and many other wealthy economies have already done this. The idea is simple enough, although the implementation is not! There are three objectives:-

  • Prevent morbidity
  • Defer disability
  • Support independence

These can all be achieved by restructuring, funding and incentivizing our health and social care systems to do so. There is good evidence for many effective actions to reduce long term ill health, starting before conception, and running up to the age of 80 or more. There are interventions for all ages, men and women, including lifestyle changes, environmental changes, health care, social support, community development and more. These are all feasible, but many fall outside the current scope of our health services – however, this can be changed.

For older people, services need to be made more client centred. Services must identify and meet the needs, of their clients, not the needs of the delivery organizations. Indeed this would be good advice for most health and social services! Most older people want to live in their own homes, or at least in the same area. This means that support to help older people needs to be  community based. I would argue that their aim ought to be to help people to live as independently as possible, in the location of their choice. Certainly we ought not to drive people into long-term care settings.

All of this is feasible, and affordable, but as I said earlier, it will not happen by accident – as the saying goes ‘Plan, or plan to fail’. Our older people deserve better.

Selected resources

There are a series of Lancet papers, published in February 2015, on ageing and health – all are worth reading.

  1. Suzman R, Beard JR, Boerma T, Chatterji S. Health in an ageing world–what do we know? Lancet. 2015 Feb 7;385(9967):484–6.
  2. Mathers CD, Stevens GA, Boerma T, White RA, Tobias MI. Causes of international increases in older age life expectancy. The Lancet. 2015 Feb 13;385(9967):540–8.
  3. Prince MJ, Wu F, Guo Y, Gutierrez Robledo LM, O’Donnell M, Sullivan R, et al. The burden of disease in older people and implications for health policy and practice. The Lancet. 2015 Feb 13;385(9967):549–62.
  4. Chatterji S, Byles J, Cutler D, Seeman T, Verdes E. Health, functioning, and disability in older adults—present status and future implications. The Lancet. 2015 Feb 13;385(9967):563–75.
  5. Banerjee S. Multimorbidity—older adults need health care that can count past one. The Lancet. 2015 Feb 20;385(9968):587–9.
  6. Steptoe A, Deaton A, Stone AA. Subjective wellbeing, health, and ageing. The Lancet. 2015 Feb 20;385(9968):640–8.
  7. Bloom DE, Chatterji S, Kowal P, Lloyd-Sherlock P, McKee M, Rechel B, et al. Macroeconomic implications of population ageing and selected policy responses. The Lancet. 2015 Feb 20;385(9968):649–57.

Three papers on compression of morbidity :-

  1. Forma L, Rissanen P, Aaltonen M, Raitanen J, Jylhä M. Age and closeness of death as determinants of health and social care utilization: a case-control study. The European Journal of Public Health. 2009 Jun 1;19(3):313–8.
  2. Payne G, Laporte A, Deber R, Coyte PC. Counting Backward to Health Care’s Future: Using Time-to-Death Modeling to Identify Changes in End-of-Life Morbidity and the Impact of Aging on Health Care Expenditures. Milbank Q. 2007 Jun;85(2):213–57.
  3. Fries JF, Bruce B, Chakravarty E, Fries JF, Bruce B, Chakravarty E. Compression of Morbidity 1980-2011: A Focused Review of Paradigms and Progress. Journal of Aging Research. 2011 Aug 23;2011, 2011:e261702.
Materials from a seminar where I first presented these ideas :-

Co-op Care seminar programme April 2015

Seminar presentation

Using OECD data on health care expenditure

Graphs of OECD data

These notes are mainly to remind me how to draw graphs which use OECD data on health outcomes, health care expenditure. like this one :-


OECD data on total health care expenditure by year across a selection of countries
OECD data on total health care expenditure as a percentage of GDP by year across a selection of countries

 The data come from the OECD stats library, which still requires a subscription. You can download data in several formats. These include Excel files, and compressed comma separated variable (CSV) files. The Excel files use ‘..’ as a missing value character, and need a bit of work to remove formatting, empty columns and rows, and the like before use. The CSV files are compressed with gzip, and I’ve found problems uncompressing them on Linux. The code below seems to work though.

gzip -dfc OECDdata.csv.gz > OECDdata.csv

I use RStudio, and usually use knitr. The libraries I load are here :-

Load necessary libraries
```{r}
library(ggplot2)
library(reshape2)
library(stringr)
library(plyr)
library(scales)
```

OECD data come in wide format, with each year's data in one column, and the variables which explain it are lined up in columns beside the years like this :-
 
 "Country","Unit","2000","2001","2002","2003","2004","2005","2006","2007","2008","2009","2010","2011","2012","2013"
 "Australia","% gross domestic product",7.6015,7.7003,7.8903,7.8959,8.1065,7.975,7.9824,8.0563,8.2678,8.6248,8.4604,8.5505,"NA","NA"
 "Austria","% gross domestic product",9.4401,9.548,9.6235,9.7954,9.9059,9.8669,9.7359,9.7435,9.9469,10.5356,10.4834,10.2371,10.4102,"NA"
 "Belgium","% gross domestic product",8.1206,8.2921,8.4618,9.6474,9.6751,9.6472,9.5809,9.6237,9.9428,10.6547,10.5577,10.6107,10.8944,"NA"
 

There are 35 rows, and 16 columns in this particular file. This format is not well suited to graphing, so I need to melt it.

#Total current expenditure as a % of GDP
TCE TCEm variable.name='Year')
#Changes values of year from X2000, X2001 etc to 2000, 2001 and so on.
TCEm$Year

What does this do? The final result looks like this :-
 
 "","Country","Unit","Year","value"
 "1","Australia","% gross domestic product",2000,7.6015
 "2","Austria","% gross domestic product",2000,9.4401
 "3","Belgium","% gross domestic product",2000,8.1206
 "4","Canada","% gross domestic product",2000,8.3075
 

There is one row for each combination of the two id variable ‘Country’ and ‘Unit’ data point. Each row in the original data set leads to 14 rows, one for every year, in the molten data set.

To make this picture I used this code:-
 
 # Total current expenditure as a percentage of GDP by year
 g geom_line(aes(x=Year,y=value, group=Country,colour=Country),alpha=0.4) +
 geom_line(data = subset(TCEm,TCEm$Country %in% Ireland),
 aes(x=Year,y=value, group=Country,colour=Country)) +
 geom_point(data = subset(TCEm,TCEm$Country %in% Ireland),
 aes(x=Year,y=value, group=Country,colour=Country)) +
 geom_line(data = IrelandAdjTCEm,
 aes(x=Year,y=value.x.revised, group=Country,colour='red')) +
 geom_point(data = IrelandAdjTCEm,aes(x=Year,y=value.x.revised, group=Country,colour='red')) +
 xlab("Year")+ylab("Percentage of GDP") +
 ggtitle("Total health expenditure against Time")+ scale_colour_hue(c=100,l=50) +
 annotate('text',x=2009,y=12,label="Ireland-GNP") +
 annotate('text',x=2012,y=8.2,label="Ireland-GDP")
 g
 ggsave("TCE.png",plot=g,width=20,height=16,dpi=100,units="cm")
 

Juggling and the older brain

If you know me, you will know that I am not the most dexterous person. I was never going to have a career as a surgeon. I read a paper some years ago that gave me hope that I might yet improve (not that I might take up surgery). I vaguely recollected that the authors had shown evidence of unexpected brain plasticity in older people, by documenting structural changes in the brain after teaching people how to juggle.

I was talking to a colleague from our Business School the other day, who, it turns out, is interested in brain plasticity, and functional MRI studies as part of her work in the Business School in DCU. I mentioned this memory to her, and she was very interested, so I went off to find the paper.

I did a little digging in PubMed, and eventually found two papers dealing with the impact of learning to juggle in older people.

The first looked at the effect of age on the ability of people to learn to juggle.

Performance on a juggling task

Performance on a juggling task by age, at baseline, after instruction and after practise. (Source – redrawn from Voelcker-Rehage C, Willimczik K, Motor plasticity in a juggling task in older adults-a developmental study. Age Ageing. 2006 Jul;35(4):422-7.PubMed PMID: 16690635.)

This graph shows the main results. There were over 900 people, across a wide range of ages (6 to 89). Each person was scored on video, doing a juggling task, first without instruction – ‘Baseline’, then after verbal instruction ‘After Instruction’, and then after 7 sessions of practise -‘After Practise’. The key finding was that, while people aged 15 to 29 did better than anyone else on this learning task, there was little indication of any further decline in performance with age.

The second paper compared MRI scans over 6 months of 69 older people (mean age 60) who were taught how to juggle. The first scan was a baseline, the second after three months, with (more or less) regular practise, and the third after a further three months, with no structured practise offered. They found that a particular area of the brain, known as the human middle temporal/V5 complex, which apparently plays a central role in the perception of visual motion, increased in size by 3 months into the study, and shrank back again by six months. There other changes in brain structure as well. These were similar to the changes they had found in a group of 20 year olds, in an earlier paper.

What does all this mean? From my perspective the most interesting finding of neuro-scientists over the last 20 years is that the human brain changes over time. Work on brain development in late adolescence and early adult life, has shown that ‘adult’ brain structure is not reached until the mid twenties. This capacity for development continues throughout life. This ties in with the evidence that learning can slow the development of Alzheimer’s disease – literally use it or lose it..

The work on juggling shows that we retain, into old age, the capacity to learn, and that this capacity does not decline much, if at all, with age. We have the capacity to change our brains as well as our minds.

Continue reading

Using R in research education

I’m at the UserR! 2010 conference at NIST in Gaithersburg, Maryland. This is the main annual event for R users. there have been whole series of presentations on using R in education. The full program lists the Pedagogic talks (3 sessions, and 9 talks, on the first day).
What I’ve seen so far is great work on training people in data analysis, in statistics and (to some extent) in probability, The work is really good, and I have lots of new ideas. What’s been lacking, and what I need to think about more, is the other part. There are at least three other elements,

  1. asking intelligent questions, that is questions that are well enough specified to be answered, and well enough considered to actually matter.
  2. using research information, and clinical information, to support good clinical decisions
  3. data cleaning, data exploration,

Any thoughts?

Google webmaster tools and wordpress

I wanted to set my site up on Google webmaster’s tools. Google offer two choices, one is to put a meta tag, with defined content, in the header of the index page. This would require programming with PHP which is a little beyond my scope. The alternative to is to download a html page, provided by Google, and put it in your website. The page is actually 1 line of text, so it’s not really html.

The obvious way to do this is to add a page with WordPress, as advised, for example, on Jalal P. Jha’s blog. Obvious, but wrong. Jalal’s advice applies, as he says, to sites hosted on WordPress.com, not to self-hosted sites, such as this. It’s possible to create a WordPress page with the correct title, but WordPress adds in a lot of invisible bits and pieces, which alter the contents of the file, which is what Google checks.

So, the solution is very simple, use ftp, to add the page provided by Google, to the right directory on your web host, in my case the root directory of this website, (/website/httpdocs/astaines) and you are done.

WordPress difficulties- wp-config.php [SOLVED]

I installed WordPress, which you are now reading, from my hosting provider’s Application Vault, and it worked beautifully, but, I wanted to use nice permalinks, which is not possible, if you have installed in this way. This was confirmed, impressively quickly, by Blacknight technical support guru Nils.

So, I installed it manually, and made a daft error, which I recount here, for the instruction or amusement of others.

WordPress configuration, from the users perspective, is done through the file ‘wp-config.php’ file, which you must create when installing manually, by editing the supplied wp-config-sample.php file. The pertinent bit is :-
/** The name of the database for WordPress */
define('DB_NAME', 'dbname');

/** MySQL database username */
define(‘DB_USER’, ‘user’);

/** MySQL database password */
define(‘DB_PASSWORD’, ‘password’); [[This isn’t my password..]]

/** MySQL hostname */
define(‘DB_HOST’, ‘localhost’);

which doesn’t work.

The error is the last line
/** MySQL hostname */
define('DB_HOST', 'localhost');

This is is in the sample file, and several bits of WordPress documentation say things like – ”leave this as ‘localhost’ for 99% of hosting suppliers out there”. However, Blacknight, and many other hosting providers keep their MySQL databases on a different server to the webservers, and so provide an internal hostname, which is what needs to go in the DB_HOST line.

In my case it is :-
Internal hostname: mysql496int.cp.blacknight.com

So the lines in wp-config.php should read

/** MySQL hostname */
define('DB_HOST', 'mysql496int.cp.blacknight.com');

which does work.

Simple when you know how…