HSE Service Plan 2015

The HSE Service plan is out today, and you can read it here. I’ve just finished reviewing it for the Pat Kenny show on Newstalk.

Some key points

  • Some money to reduce waiting lists in acute hospitals
  • Some money to support moving patients out of hospitals in to home care or long term care
  • Hospital groups to happen
  • Palliative care service in the Midlands for the first time
  • Better access to diagnostics for GPs – ultrasound now, more services in 2016
  • Some increase in spending on disability services and mental health
  • 0.7% increase in spending from 2014 outcome
  • New use of balanced scorecard methods to hold managers to account
  • More investment in ICT

Continue reading

Have your Say in Ireland – Seanad Éireann

The next Seanad will be elected, most likely in June 2016, in the same unsatisfactory way as the current Seanad. Most of the senators will be elected by the votes of local authority members, and members of the Dail. The Taoiseach will appoint eleven senators. Six members will be elected, most likely as at present, three by graduates of TCD, and three by graduates of the NUI. There is a slim chance, if the bill on electoral reform is passed very quickly, that six candidates will be elected by graduates of all higher education institutions (HEIs) in the state. Unfortunately, given that the next election has to happen by the end of March 2016, at the latest, it looks as if even this modest reform may not happen in time.

What can we do to make the best of this bad lot? The only part of the Seanad that has any shred of democratic legitimacy are the two third level panels. This is far from perfect, with a very restricted franchise, but it is the best we are likely to have in time for the next election. It is also the only place where Irish citizens living outside Ireland can influence Irish elections, and it might form the seed for more effective Seanad reform after the next Oireachtas elections.

If this is to happen, I think we need to get as many people as possible voting, and that means encouraging people to register for their votes, and use them. The Seanad electoral register closes on February 26th, and will be used from June 2015. The only requirements are that you must be an Irish citizen, and you must have graduated from the NUI or TCD.

From today, November 2nd, there are 116 days to go. Please help me to get the word out. I’ve set up a Facebook page for this at http://www.facebook.com/HaveYourSayInIreland.

Trinity graduates

Full information about the Trinity Seanad election and the electoral register is here. Short version, you have to fill in this form, sign it, and post it to Student & Graduate Records, Academic Registry, University of Dublin, Trinity College, Dublin 2. It must be received by Thursday February 26th, 2015. You may not email it.

TCD degrees

Most eligible graduates attended Trinity, but there are also many DIT graduates who have TCD degrees. I’m not aware of any other such institutional links. Please let me know if I am missing any. Please note, you have to be an Irish citizen to vote, but you do not need to be Irish resident.

NUI graduates

Full information about the NUI Seanad election, and the electoral register is here. Short version, you have to fill in this form, sign it, and post it to National University of Ireland, Records Office, 49 Merrion Square, Dublin 2. It must be received by Thursday February 26th, 2015. You may not email it.

List of NUI colleges

The list of NUI colleges is longer than you might think. Besides the obvious, UCD/UCC/NUIG/NUIM, it includes RCSI, NCAD, the IPA, Milltown, and the Shannon College of Hotel Management. Some graduates of other institutions are also eligible, depending on exactly when you graduated – these include Mary I, St. Pat’s Drumcondra, NIHE Limerick (but not NIHE Dublin), Thomond College, and St. Angela’s. A full list is here. Please note, you have to be an Irish citizen to vote, but you do not need to be an Irish resident.

Funding universities – newish ideas from the IEA

There is an admirably bonkers new paper from Peter Ainsworth of the IEA with the title “Universities challenged: funding higher education through a free-market ‘graduate tax’”. I’m obsessed, amongst other things, with ways of funding higher education, so I read it cover to cover.

Some background first, as many people will not be familiar with the IEA. They describe themselves as a think-tank whose members, “all those associated with the Institute support free markets – though with different “schools” of free market economics being represented”. Their official history begins with a quote from John Blundell, their former director-general thus “Hayek advises Fisher; Fisher recruits Harris; Harris meets Seldon. In nine words, that is the start of the IEA.” This gives a pretty good idea of their perspective on the world. It isn’t mine.

The report itself, a concise 52 pages, has a good deal of useful material. There is a very good summary of how the UK got to their current situation, where a student loan scheme, intended to reduce Government payments to Higher Education, is now likely to cost more than the direct grant system it replaced. There is a very lucid analysis of the different economic perspectives of students, higher education providers, and the state. There is also a good description of the various perverse incentives in the current system in the UK. There is nothing on the perverse incentives on other countries, for example the US. There is less on the perspective of the families of students, but this is, I think, a relatively minor omission. There is a good review of the graduate premium to earnings, with useful data showing how it has varied over time, and between disciplines. There is particular emphasis on the variation between individuals in this premium, and the consequent uncertainty about investing in Higher Education.

Ainsworth’s key idea is this ” Universities should individually or collectively offer contracts to their students, who would agree to pay to the university they attended a given percentage of their [future] earnings. That percentage could vary by course and institution, though some agreement between universities could be helpful to achieve standardisation. Essentially, the university would be taking an equity interest in the graduate premium earned by the student, although any student who chose to do so could, alternatively, pay the full fees up-front prior to beginning their studies.”

He suggests that, based on a few models around the world, this might be between 4% and 10% of their income over a certain level, for a number of years, and that these payments should receive tax relief. This would be a private contract, and, as such, universities could securitize the earnings.

What’s right with this idea?

  • It could do a good job of aligning the economic interests of students and universities. Presumably institutions whose graduates were of very poor quality, as perceived by employers, would do badly. There would certainly be a strong incentive for universities to give students access to skills and competences, rather than information. Some of these would be specifically vocational, and others more generic.
  • Higher education would be free at the point of use, at least in the sense that there would be no upfront fees. These are, to say the least, a disincentive to poorer students. Ainsworth suggests that the state might choose to provide maintenance grants to support some students at university.
  • It would do a very good job of sharing the risk in choosing to do higher education between the students and the university, with the university taking all the downside risk – i.e. the student never gets a high enough salary to start paying.

What’s wrong with it? Ainsworth does try to address several challenges, for example, there would be an obvious incentive for universities to concentrate on subjects with a high graduate premium – putting less vocational course at risk. Such courses could instead be state supported, as a matter of public policy.

I see some further serious objections, which are not fully considered.

  • Incentives to select students – there would be a huge incentive to the university to cherry pick students, and I foresee a large premium on very low risk people, for example white male students from UK ‘public’ schools (i.e. private schools in other countries). Students with disabilities would be a significant risk to the university.
  • Incentives to select the courses provided – many universities, including all those I’ve worked in, provide courses which are actually uneconomic, or at best very very marginal. We also do a lot of experimentation, running course for a few years to see if they meet a need. These courses, and the associated innovation, provide a wider range of choices for our students, and support a wider range of voices and perspectives within higher education. I doubt that targeted government subsidies would, or could continue to support these.
  • Cost – the cost of collecting these funds is not discussed, apart from a suggestion that universities might get together to do it, or set up a common organization to collect the money. This is not unreasonable, but I suspect the costs would eventually eat up a sizable fraction of the money collected, perhaps 20% or more. The cost of collection is a critical part of any higher education funding system.
  • Risk – bringing in such a scheme is fraught with risk. There would be very large uncertainties, which would put at very serious risk any but the most well endowed (i.e. highly capitalized) of higher education providers. The education system requires fairly stable funding, if it is desired to provide a stable education. A reasonable estimate is that is takes 5 to 6 years from the start of development, to the first graduation of student from a new 4 year degree program. It might be another decade before the graduate premium from such a program could even be estimated. It would be very hard to make a business case for such an investment. The transition costs of any major shift in education funding are large, and are not considered by Ainsworth.
  • Feasibility – Ainsworth argues, on the basis of a number of examples, that such a scheme is feasible. The examples he gives are for small scale, highly targeted schemes. I’ve reviewed each of them, as best I can, and I remain very dubious of the ability to scale such ventures. One important example, CareerConcept AG seems to have had no media activity since 2011, which is surprising. Lumni looks much more promising, but has still only covered 5,000 students in four countries since 2002.

In short, I think the IEA report well worth reading, but I do not think that the proposals in it are feasible, desirable, or affordable. The UK desperately needs a better system of funding Higher Education. This isn’t it.

Using OECD data on health care expenditure

Graphs of OECD data

These notes are mainly to remind me how to draw graphs which use OECD data on health outcomes, health care expenditure. like this one :-


OECD data on total health care expenditure by year across a selection of countries
OECD data on total health care expenditure as a percentage of GDP by year across a selection of countries

 The data come from the OECD stats library, which still requires a subscription. You can download data in several formats. These include Excel files, and compressed comma separated variable (CSV) files. The Excel files use ‘..’ as a missing value character, and need a bit of work to remove formatting, empty columns and rows, and the like before use. The CSV files are compressed with gzip, and I’ve found problems uncompressing them on Linux. The code below seems to work though.

gzip -dfc OECDdata.csv.gz > OECDdata.csv

I use RStudio, and usually use knitr. The libraries I load are here :-

Load necessary libraries
```{r}
library(ggplot2)
library(reshape2)
library(stringr)
library(plyr)
library(scales)
```

OECD data come in wide format, with each year's data in one column, and the variables which explain it are lined up in columns beside the years like this :-
 
 "Country","Unit","2000","2001","2002","2003","2004","2005","2006","2007","2008","2009","2010","2011","2012","2013"
 "Australia","% gross domestic product",7.6015,7.7003,7.8903,7.8959,8.1065,7.975,7.9824,8.0563,8.2678,8.6248,8.4604,8.5505,"NA","NA"
 "Austria","% gross domestic product",9.4401,9.548,9.6235,9.7954,9.9059,9.8669,9.7359,9.7435,9.9469,10.5356,10.4834,10.2371,10.4102,"NA"
 "Belgium","% gross domestic product",8.1206,8.2921,8.4618,9.6474,9.6751,9.6472,9.5809,9.6237,9.9428,10.6547,10.5577,10.6107,10.8944,"NA"
 

There are 35 rows, and 16 columns in this particular file. This format is not well suited to graphing, so I need to melt it.

#Total current expenditure as a % of GDP
TCE TCEm variable.name='Year')
#Changes values of year from X2000, X2001 etc to 2000, 2001 and so on.
TCEm$Year

What does this do? The final result looks like this :-
 
 "","Country","Unit","Year","value"
 "1","Australia","% gross domestic product",2000,7.6015
 "2","Austria","% gross domestic product",2000,9.4401
 "3","Belgium","% gross domestic product",2000,8.1206
 "4","Canada","% gross domestic product",2000,8.3075
 

There is one row for each combination of the two id variable ‘Country’ and ‘Unit’ data point. Each row in the original data set leads to 14 rows, one for every year, in the molten data set.

To make this picture I used this code:-
 
 # Total current expenditure as a percentage of GDP by year
 g geom_line(aes(x=Year,y=value, group=Country,colour=Country),alpha=0.4) +
 geom_line(data = subset(TCEm,TCEm$Country %in% Ireland),
 aes(x=Year,y=value, group=Country,colour=Country)) +
 geom_point(data = subset(TCEm,TCEm$Country %in% Ireland),
 aes(x=Year,y=value, group=Country,colour=Country)) +
 geom_line(data = IrelandAdjTCEm,
 aes(x=Year,y=value.x.revised, group=Country,colour='red')) +
 geom_point(data = IrelandAdjTCEm,aes(x=Year,y=value.x.revised, group=Country,colour='red')) +
 xlab("Year")+ylab("Percentage of GDP") +
 ggtitle("Total health expenditure against Time")+ scale_colour_hue(c=100,l=50) +
 annotate('text',x=2009,y=12,label="Ireland-GNP") +
 annotate('text',x=2012,y=8.2,label="Ireland-GDP")
 g
 ggsave("TCE.png",plot=g,width=20,height=16,dpi=100,units="cm")
 

Patients First meeting in Navan

I’m just back from the Patients First meeting in Navan. This is their third meeting, but the first I’ve been able to get to. Their core goals of the campaign are :-

  1. Budget must protect health service and patient care.
  2. An independent, transparent, free, easily accessible, feedback mechanism that provides all patients, carers and family members the opportunity to share their healthcare story and engage with service providers.
  3. Safe staffing based on patient dependency alone.
  4. Legislated requirements to publicly display daily staffing levels vis-à-vis patient dependency requirements.
  5. Legislated requirements to publicly consult and assess all cost improvement plans.
  6. National long term strategy for patient involvement and engagement across Ireland.

There was a respectable attendance, with about 40 people there, in the Newgrange hotel. The audience was a mixture, with several nurses from the area, including Navan hospital, and the local hospice team; a scattering of politicians (full list on their website) including TDs Helen McEntee and Regina Doherty; a couple of people with specific stories of bad outcomes; and several other local people. The speakers were my old friend Hilary Dunne of Patient Opinion Ireland and Karen Clarke from the INMO and Drogheda. David Hughes of the INMO chaired the evening.

The format was interesting. It started with a video from the BBC about the Francis inquiry into the Mid-Staffs trust disgrace. I re-read the executive summary over the weekend, to prepare for this evening. It still shocks and upsets me. I’ve been ill and helpless in hospital in Ireland, more than once, but I always got great care. I might not have been so lucky over there. If you haven’t read it, please do.

Then Hilary and Karen spoke briefly, presenting their personal perspectives on the issue. Stephen McMahon, and Steve Tweed, who were meant to speak as well, were caught in the tailback on the M50/M1 junction, and didn’t make it over. It was passed over to the floor then. There were three patient stories, one from the patient themselves, and two from relatives. Several other people, including the local councillors and TDs spoke as well.

What did I think? This was a genuinely useful meeting. The patient stories are a powerful narrative, and serve to focus attention on why we need to reform the service. The response of the politicians was very positive and constructive. The two TDs will be going back to Minister Varadkar, and one hopes that he will take their feedback seriously. There is the nucleus of a group here to lead the wider discussion on the structure and funding of the services, which I think is needed. The patient centred approach, and the explicit recognition of the importance of patient’s voices are a huge benefit to any further policy discussions.

A good evening, and congratulations to the organisers.


Juggling and the older brain

If you know me, you will know that I am not the most dexterous person. I was never going to have a career as a surgeon. I read a paper some years ago that gave me hope that I might yet improve (not that I might take up surgery). I vaguely recollected that the authors had shown evidence of unexpected brain plasticity in older people, by documenting structural changes in the brain after teaching people how to juggle.

I was talking to a colleague from our Business School the other day, who, it turns out, is interested in brain plasticity, and functional MRI studies as part of her work in the Business School in DCU. I mentioned this memory to her, and she was very interested, so I went off to find the paper.

I did a little digging in PubMed, and eventually found two papers dealing with the impact of learning to juggle in older people.

The first looked at the effect of age on the ability of people to learn to juggle.

Performance on a juggling task

Performance on a juggling task by age, at baseline, after instruction and after practise. (Source – redrawn from Voelcker-Rehage C, Willimczik K, Motor plasticity in a juggling task in older adults-a developmental study. Age Ageing. 2006 Jul;35(4):422-7.PubMed PMID: 16690635.)

This graph shows the main results. There were over 900 people, across a wide range of ages (6 to 89). Each person was scored on video, doing a juggling task, first without instruction – ‘Baseline’, then after verbal instruction ‘After Instruction’, and then after 7 sessions of practise -‘After Practise’. The key finding was that, while people aged 15 to 29 did better than anyone else on this learning task, there was little indication of any further decline in performance with age.

The second paper compared MRI scans over 6 months of 69 older people (mean age 60) who were taught how to juggle. The first scan was a baseline, the second after three months, with (more or less) regular practise, and the third after a further three months, with no structured practise offered. They found that a particular area of the brain, known as the human middle temporal/V5 complex, which apparently plays a central role in the perception of visual motion, increased in size by 3 months into the study, and shrank back again by six months. There other changes in brain structure as well. These were similar to the changes they had found in a group of 20 year olds, in an earlier paper.

What does all this mean? From my perspective the most interesting finding of neuro-scientists over the last 20 years is that the human brain changes over time. Work on brain development in late adolescence and early adult life, has shown that ‘adult’ brain structure is not reached until the mid twenties. This capacity for development continues throughout life. This ties in with the evidence that learning can slow the development of Alzheimer’s disease – literally use it or lose it..

The work on juggling shows that we retain, into old age, the capacity to learn, and that this capacity does not decline much, if at all, with age. We have the capacity to change our brains as well as our minds.

Continue reading

Consultant salaries in Ireland – some evidence

There’s been a lot of discussion about public sector salaries over the last few days, and in particular about consultant salaries. A revised salary scale has been proposed for all newly appointed consultants, raising the starting and final salaries significantly. At the same time there are pre-budget murmurings about raising public sector salaries again. I am, of course, a public sector worker, so I am not entirely disinterested in this. My 2c are that if any public sector salaries are to rise, this rise should be confined to the lowest paid workers. People like me, on high salaries, ought not to be getting a sniff of a salary rise for several years to come.

Leaving that to one side, I want to look at the evidence on consultant salaries. I am a doctor, but I’m not a consultant. I’ve worked in hospitals for quite a few years, although not recently, and I spent a lot of time as a patient a few years back. I also work with quite a few consultants, and trainees (i.e. non-consultant hospital doctors) on various research projects.

The question being asked is simple enough. Are Irish consultants well paid, or poorly paid, by comparison with their peers? The context is two-fold; first, there is a really serious problem getting people to apply for and accept consultant posts in Irish hospitals; second, consultant salaries were cut quite sharply, like most other public sector salaries, between 2009 and 2013.

What is the evidence? The main source is the OECD Statistics database. The OECD collects a lot of information about various aspects of the health services in their member states, and they put a lot of effort into making these as comparable as possible. They collect information on the incomes of medical consultants (Health -> Health Care Resources -> Remuneration of health professionals). For Ireland, the OECD only collects information on the salary of consultants, not on their private earnings. These earnings are quite substantial, a point to which I will return. The OECD presents this information in a number of ways, each of which tells a slightly different story.

First a caveat, while the OECD does a lot of work to make these figures as reliable as possible, there are still big problems. All the data are averages, so you can’t compare pay-scales directly. The pension levy is not deducted from the Irish salaries, but it is definitely deducted from the take-home pay. The salaries exclude private practise income, which varies hugely. No data is collected on the up to 500 (or so) fully self-employed private consultants in Ireland. UK data may not properly account for merit awards. What is classified as a consultant in one place, is not necessarily a consultant elsewhere. In a word, these data are usable, but not necessarily always right.

I’ve done a series of graphs, each of which I will discuss separately. In each of these graphs each country has a different colour. Those self-employed( dots) and those on salaries (solid line) are drawn with different types of line. Ireland is always shown as a solid line with large dots added, and this line is labelled as well.

Specialist incomes as a proportion of the average wage

Specialist incomes as a proportio of avergae wages - Data from OECD

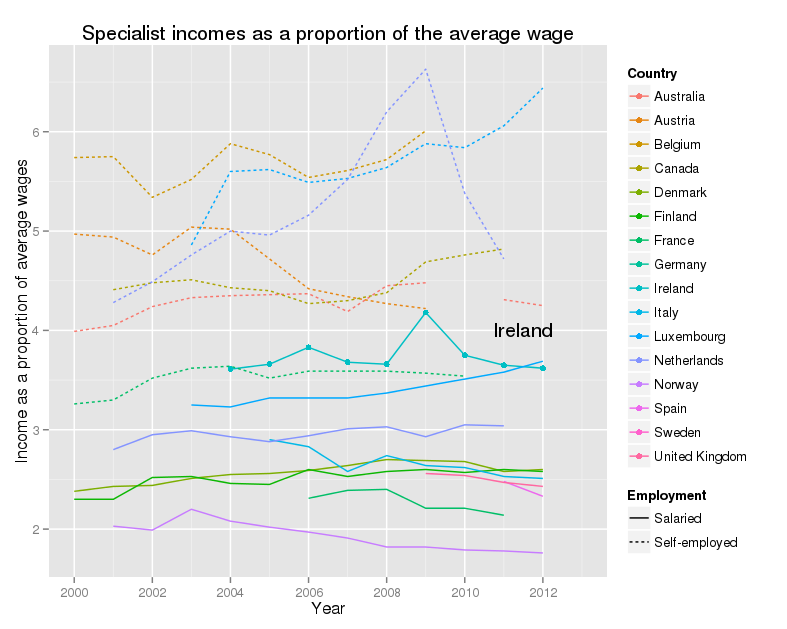
This graph shows, for a wide range of OECD countries, the incomes for salaried and self-employed consultants, as a proportion of the average wage, from 2000 to 2012. For Ireland in 2012, this figure was 3.65, so in that year an average Irish consultant earned, from their salary alone, more than 3 and a half times as much as an average Irish worker. Irish consultants are towards the top of the salary scale. Their actual salary fell sharply, but so did everyone else’s, so the proportion is pretty flat. The other thing to notice is that self-employed consultants make far more money than salaried consultants. There are issues with accounting fully and properly for their costs in running the practise, but the overall message is pretty clear. Note that there are no data on private income for Ireland.

Specialist incomes in US$ at purchasing power parity

Specialist incomes in US$ PPPData from OECD

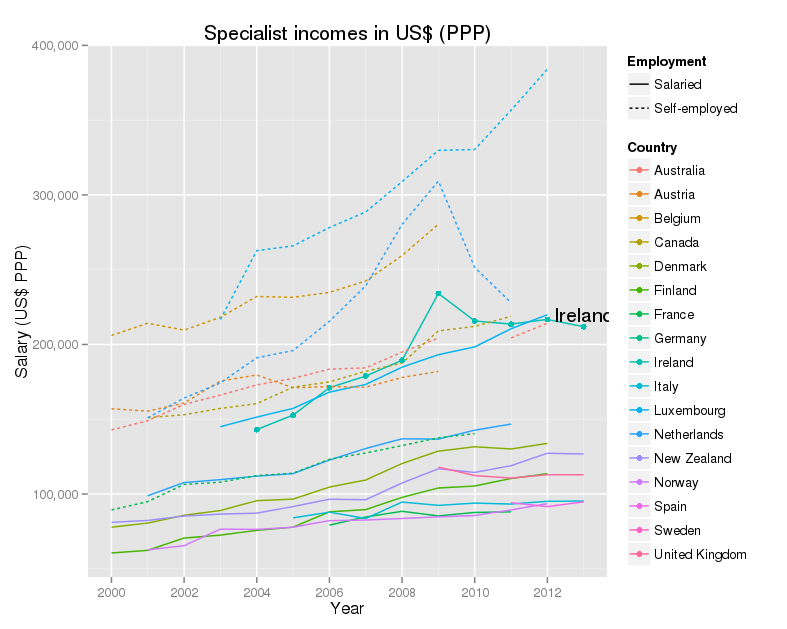
A different way of looking at the same figures is given by using a common currency. In this case the OECD use what are called “US dollars at purchasing power parity”. The idea is that money, even in a common currency, is worth less where the cost of living is high. OECD calculates a rough equivalent, between countries, and over time, for the amount of money that will buy an equivalent lifestyle, allowing for these varying costs. The story this graph tells is very similar. Irish consultants do well, coming at the top of the salaries with their colleagues in Luxembourg. Self-employed consultants do better.

Specialist incomes in Euro

Specialist incomes in Europe - Data from OECD

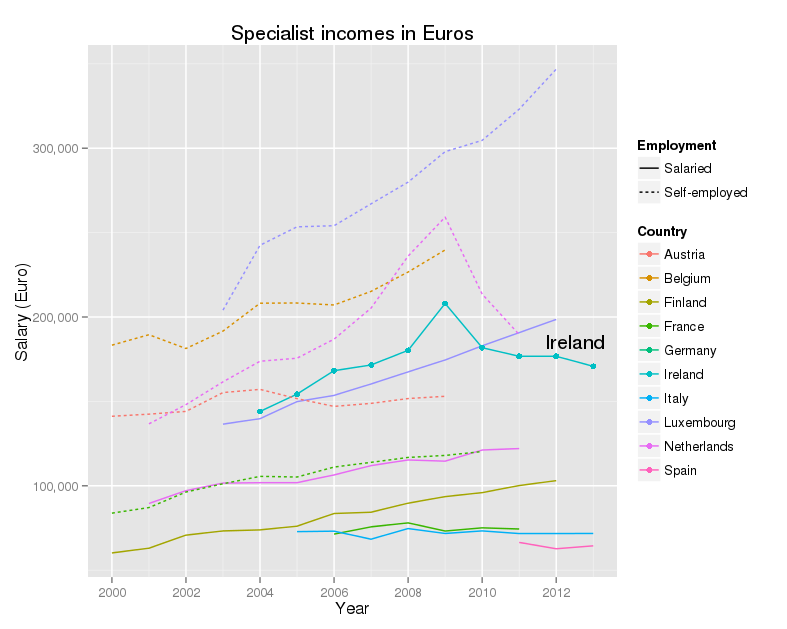
US dollars at purchasing power parity are all very well, but not exactly familiar. Euros are probably more useful for most of us. This graph shows the data for the Eurozone countries only. The picture is very similar to the previous graph.

What does all this tell us?

Allowing for the limitations of the data, I do not think that one can argue that Irish consultants are underpaid. I do think that they deserve high salaries – being a consultant is a tough job, with long hours and heavy responsibilities. Part of the confusion is that the salaries of Irish consultants are being compared with the incomes of self-employed consultants in other countries. Their salaries are notably lower than the incomes of self-employed consultants in other countries, but this is what you would expect.

What isn’t known, as far as I know, is the total income of Irish consultants. It is known that the private insurance companies pay about €360 million annually to the consultants, but, again as far as I know, there is no information on their office fee income, nor on the other costs that have to be met from this income (e.g. rent, office staff and so on), nor on how these fees are distributed (there is enormous variation in the private practise incomes of Irish consultants). It would be useful to have these figures.

The figures we do have suggest a need to ask a very serious question. Given that the salary covers only a proportion of the income of our consultants, how much should they receive, in total, as a fair compensation for their difficult and challenging work? I don’t have an answer for this, but I think that there is a real need for a careful, objective discussion of the topic. Consultant salaries are a sizable proportion of our total health expenditure, and we have to make sure that we are getting value from this spend.

My other question was “why is it so hard to recruit people for consultant posts in Irish hospitals?” As far as I know, no-one really knows, although there is a study going on at the moment. Pending the results of this work, there may be some clues in the latest Medical Council report on the medical workforce. Striking features are high rates of withdrawal from the register for younger doctors, and a very high proportion of doctors (1 in 3) who qualified outside Ireland. None of this suggests a service that is very attractive to its own.

Talking to colleagues over the last few years, the impression I have is that many people are unhappy about coming to work in Ireland. Some points people have made to me :-

  • Almost all consultants work very hard, and work very long hours
  • Most work significantly more than their contracted hours in the public sector
  • Our health system is complicated, with poor communications, mostly by mail, fax and telephone
  • Hospital bed utilization is extraordinarily high by international standards
  • Primary care is critically underfunded, so a great deal of that work lands back into the hospitals
  • Information systems are weak, and many processes are done manually, that have been automated in other countries for many years

Nonetheless salary cuts matter – I was enlightened by a colleague who drew my attention to the final report of the Strategic review of medical training and career structure. One of their recommendations (page 81) is :-

“The Working Group recommends that the relevant parties commence, as a matter of urgency, a focused, timetabled IR engagement of short duration to address the barrier caused by the variation in rates of remuneration between new entrant Consultants and their established peers that have emerged since 2012.”

I gather this was based on strong representations from trainees who met with the group, who intimated that the salary differential (of 30% between new entrants and existing staff) was the main factor, though by no means the only factor in their decision making.

So salary cuts do matter. It is possible that the new salary scales will produce the desired flood of people applying for posts in our services. I certainly hope so. However, I remain of the view that we need to fix many other issues in our services as well, if we are to keep these people working here, and have a decent and affordable service.

Acknowledgments

Colleagues, who had better remain anonymous, unless they wish to comment below, have very helpfully critiqued my observations. I appreciate this. I have a better grasp of the limits of the OECD data, and have found work on the attitudes of senior trainees to the lowered salaries for new entrants – their views were very negative. I was wrong to argue that salary cuts were relatively unimportant – they were (and are) important, but still not the whole story.

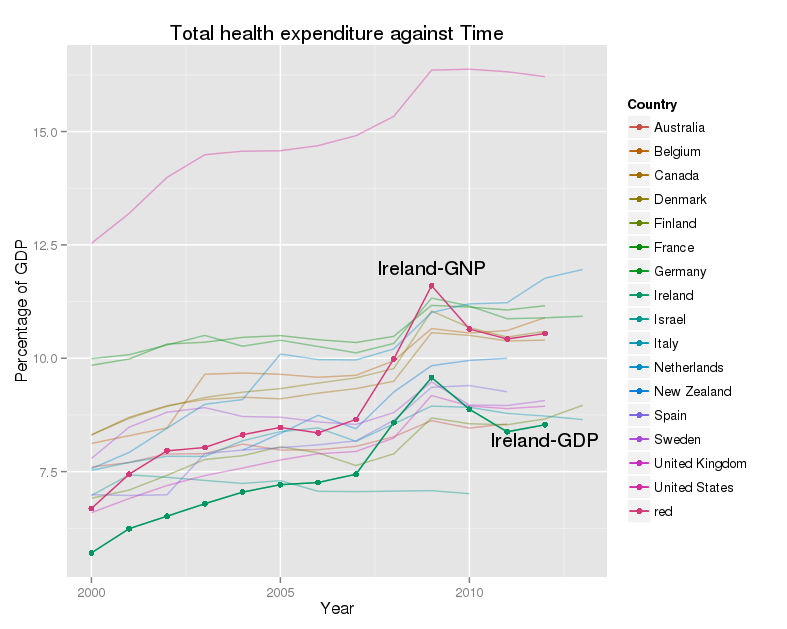
Appendix – specialist incomes and GDP/GNP

The OECD presents the earning figures in one further way, by comparison with GDP per capita. This is a very rough guide to the wealth of a country. Because Ireland is the home to a large number of multi-national companies, with very large exports, Irish GDP is not regarded as the best guide to the size of the economy. GNP is preferred. The CSO publish GDP:GNP ratios annually, and the latest published is for 2012. The ratio has fallen from about 0.85 in 2004 to 0.81 in 2012. I’ve assumed that the figure for 2013 will be similar. I’ve calculated the salaries of consultants as a share of the per-capita GNP, and added this to the graph.

Specialist incomes as a proportion of per-capita GDP - Data from OECD - Data for Ireland as a proportion of GNP added using CSO figures.

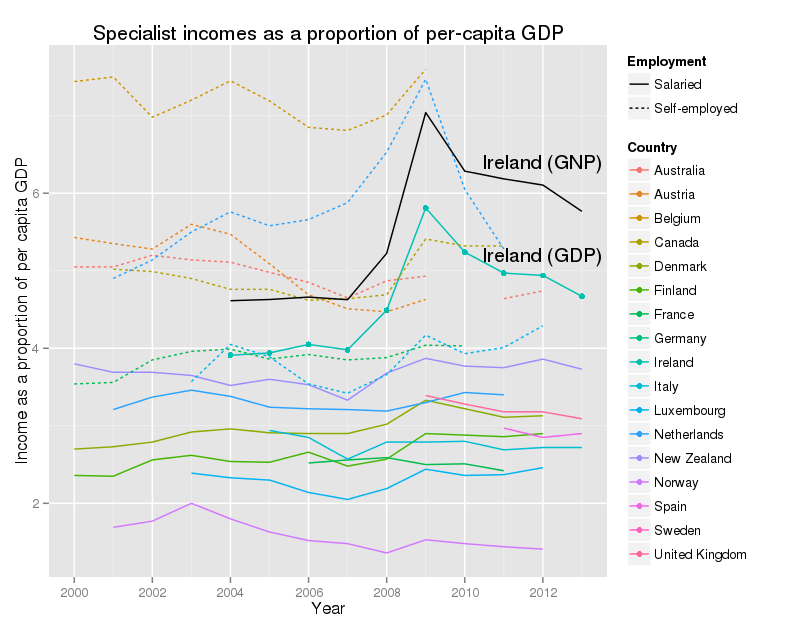
This shows a similar story to the other graphs, with one interesting twist. What is very noticeable is that Ireland is now much further up the rankings, both for GDP, and especially for GNP. This says, that relative to the wealth of the country, our consultants are well-paid. Again this excludes their private incomes. The peak in 2009 reflects the collapse in GNP, and not a rise in consultant salaries.

Technical note

The graphs are done in R using Hadley Wickham’s elegant ggplot2.

Colocation, colocation, colocation

Final decisions on the National Paediatric Hospital will be made shortly. One key element in the plan is colocation. What is it, and what are the implications of colocation for hospital site selection?

Colocation is the location on the same or adjacent sites of a children’s hospital, an adult hospital and a maternity hospital. There are several distinct types of colocation, with different objectives. To begin with I consider the likely effects of different types of colocation on patient care.

First, is colocation of paediatric services. The aim is to put all national tertiary paediatric services, and the secondary paediatric services for the Dublin region, on one site. At the moment these services are split across four sites, Crumlin, by far the largest site, Temple St, Tallaght, and Beaumont. There are several reasons why this is a good idea.

  • Managing the complex needs of very sick children demands close co-operation between many specialist doctors, nurses and other experts.
  • Requiring some staff to work across sites, imposes heavy travel time costs on them, and reduces the level of service they can provide.
  • There are significant economies of scale in providing access to costly technologies, for example MRI and PET scanners, the more complex laboratory facilities, and specialised theatre facilities.
  • Facilities with high throughput of patients are better for training more specialized clinical staff, and provide more opportunities for research.
  • Follow-up and rehabilitation care for recovering children often requires intermittent access to a wide range of specialists, which is easier to provide at a centre supporting a full range of services.
  • Provision of education and play for sick children, some of whom will spend many months, or even several years, on and off, in hospital.
  • Provision of both on-ward and off-ward accommodation for the parents of seriously ill children.

To achieve this any proposed site must have space for the full range of secondary and tertiary paediatric services. This is the case for most of the major international childrens’ hospitals.

Colocation of the children’s hospital and a major maternity hospital is also of great practical importance. The aim is to have immediate access to a full range of specialists, operating theatres and intensive care for the sickest newborn babies. This matters because, about one quarter of the children currently in the intensive care unit in Crumlin are newborn babies. Many of these high risk babies can now be identified before delivery. This allows the transfer of their mothers for delivery, which is much better for the baby than a long ride, late at night, in an ambulance. This colocation will support the future development of new specialised services, such as foetal surgery.

Colocation of an adult hospital and a maternity hospital has been less often discussed, but is also important. Every maternity hospital already has arrangements with local adult hospitals to support the care of pregnant women. Colocation makes these arrangements more substantial, and allows their wider development. A small number of pregnant women each year develop serious illnesses, beyond the capability of even a well-equipped maternity hospital. Equally, a small number of seriously ill women are also pregnant, and need the expert intervention of obstetricians and midwives to secure the best possible pregnancy outcomes. In both cases, this is best achieved by access to an onsite, or adjoining, adult hospital. The three big Dublin maternity hospitals are almost unique worldwide in not having such facilities.

Colocation of a childrens’ hospital and and adult hospital also has some clinical benefits. In the past, many of the more specialized paediatric services were provided by adult specialists who also did some paediatric work. This model of practice is passing, and almost all paediatric services are now provide by fully trained paediatric specialists. What is more relevant, is the transfer of care from paediatric services, to services for older adolescents and adults. This is facilitated by colocation, but only adolescents living in Dublin will benefit, as those living outside will have their care transferred to their local hospitals anyway.

Trilocation, that is the provision of maternity, paediatric, and acute adult hospital services on the same or adjacent sites is an ideal model. Most, but not all, of the large modern children’s hospitals that I have reviewed, are colocated with a maternity hospital, and a majority are colocated with an adult hospital. This model, if run well, provides the clinical benefits of the other types of colocation.

Besides the clinical benefits, better integration of management systems brings huge benefits. These include better efficiency, leading to lower costs, and better operational performance, leading to better outcomes. Many of these improvements do not require colocation, but all will be facilitated by it. These include common governance and audit systems, common infection control, common purchasing and personnel systems, common laboratory, imaging and IT facilities, more effective staff management, and better accountability for service delivery. Arguably, if colocation is to succeed, setting up this integration ought to precede the design and build of the new hospital buildings. Indeed, it would be fair to criticize the existing National Paediatric Hospital board, for their failure to begin doing this.

A further advantage of a single paediatric facility is in building up the scale and scope of both research, and training. The existing hospitals have modest, and moderately successful, research units. This division of a limited capacity across three sites seriously impedes Irish research into childhood disease. Horizon 2020, the next EU funding scheme for research has great opportunities for Ireland. Other countries have built major clinical and biological research centres, which are major employers. To do this, we would need a critical mass of researchers, doctors, nurses and patients. The NPH, on a single site, beside a research active adult hospital, would be a great start. Training is also inhibited by the the fragmented paediatric services. Ireland does not have the resources to provide advanced training in the care of sick children in three places. Again, a single hospital will greatly improve our capacity to offer advanced training to the next generation of doctors, nurses, and other child health professionals. Co-location with maternity and/or adult hospitals will provide further benefits in training and research.

Any proposed site for the new hospital needs to have the space to include all of these elements. A single acute inpatient facility for the children of Dublin, and a single tertiary centre for the children of Ireland, ought both to be non-negotiable. In my view, the next requirement is a colocated maternity hospital. Given the fiscal realities of Ireland today, this means one of the three Dublin maternity hospitals, based on its present site. It is nice to dream of shiny new maternity hospitals on green field sites, but its not going to happen. The very sickest babies in Ireland ought to be spared long ambulance transfers wherever possible. An acute adult hospital, either on site, or adjoining is also very desirable. Finally any site must have space for expansion. New buildings will be needed. Old buildings will need to be refurbished. Doing this essential work on a cramped site raises costs and increases the risks to children.

We can built a really good facility for Irish children, for Irish mothers and for Irish adolescents. We need less territoriality, less spin, and more focus on the actual needs of sick children and their families. We need the integration of management systems, and boards, to begin as soon as the constituent bits are identified. We need all of this in the next few weeks. Will we get it? Watch this space…

The UK Quality and Outcomes Framework for NHS GPs – Did it work, and should we copy it?

Quality and Outcomes Framework – summary report of a meeting held by the primary care research groups of the Royal Statistical society (RSS) meeting Monday 21st November, Errol St. London.

Speakers

  • Nick Steel
  • David Reeves
  • Tim Doran

What I report here is my interpretation of what the speakers said combined with the audience discussion afterwards. The speakers are not responsible for anything they disagree with!

Background

The Quality and Outcomes Framework (QOF) is a system of payments to British GPs introduced in April 2004. In brief, GPs have a set of targets, mostly oriented towards certain chronic diseases, and they receive substantial payments for hitting these targets for a high proportion of relevant patients. There is evidence supporting the benefit of hitting each of these targets. The relevant patients are declared by each practice on a series of practice registers, for example one for people with diabetes, one for people with known heart disease, and so on.

For example, a GP practice would register patients at risk of coronary heart disease. If a recent blood pressure (within the last 15 months) is under 150/90 a patient has met that target. A GP where less than 40% of the relevant patients meet the target gets nothing. A GP where 70% of the relevant patients have met the target gets 30 points, and there is a sliding scale between these points.

The QOF contains four main components, known as domains. The four domains are: Clinical Domain, Organisational Domain, Patient Experience Domain and Additional Services Domain. Each domain consists of a set of achievement measures, known as indicators, against which practices score points according to their level of achievement. The 2010/11 QOF measured achievement against 134 indicators; practices scored points on the basis of achievement against each indicator, up to a maximum of 1,000 points.

  • clinical care: the domain consists of 86 indicators across 20 clinical areas (e.g. coronary heart disease, heart failure, hypertension) worth up to a maximum of 697 points.
  • organisational: the domain consists of 36 indicators (worth up to 167.5 points) across five organisational areas – records and information; information for patients; education and training; practice management and medicines management.
  • patient experience: the domain consists of three indicators (worth up to 91.5 points) that relate to length of consultations and to patient experience of access to GPs.
  • additional services: the domain consists of nine indicators across four service areas – cervical screening, child health surveillance, maternity service and contraceptive services.

The QOF gives an indication of the overall achievement of a surgery through a points system. Practices aim to deliver high quality care across a range of areas for which they score points. Put simply, the higher the score, the higher the financial reward for the practice. The final payment is adjusted to take account of surgery workload and the prevalence of chronic conditions in the practice’s local area (Source http://www.qof.ic.nhs.uk/). A practice getting maximum points across all targets gets about £ST130,000 extra a year. QOF payments come to GP practices through the Primary Care Trust with which they are affiliated. Overall the QOF costs about £ST1 billion a year.

The targets are measured as reported by the GPs from their IT systems. The PCTs do not have direct access to these, but an abstract is supplied to the PCTs by each practice.

Evaluations

The QOF was introduced in a big bang across the whole of the UK in April 2004. This was at the insistence of the BMA, who opposed a phased roll out. No baseline data were collected beforehand. In particular, no data on the proportion of GP practices meeting the various targets before the QOF started were collected. This was because of political pressure to do something fast about General Practice. The result was that no assessment was done of the QOF. A number of studies have now been done with ambivalent results. These were done using synthetic indicators made from existing GP data gathered for research purposes, for example, the GP Research Database. These show significant improvement in the indicators over time, but little evidence for most indicators, that the rate of improvement sped up when the QOF was introduced. There are indicators which rose faster in the first year of the QOF, but returned to the earlier trend of improvement from the second year on. An extensive systematic review of the QOF will be published in the next few weeks, and these results are from a preview given by one of the authors.
Pay-for-performance, and the cost-effectiveness of the QOF

The OQF is a pay-for-performance system. The research evidence on these systems is that they benefit productivity if the work being done is mechanical and repetitive. If the work involves even rudimentary cognition pay-for-performance does not work. There are case studies from Maine in the USA, where strict targets for diabetes care were set, and primary care doctors got a small sum of money ($10) for hitting these. This was modestly effective. Overall QOF has reduced inequalities in the indicators measured between practices in poor, middle income, and rich areas, but there is little evidence of markedly improved health for a very large investment. Nurses generally like it because it has improved their working patterns, and expanded their practice. Doctors tolerate it, claim not to like it, but feel that it has improved practice.

Issues

There is extensive gaming of the QOF. Most PCTs do not police it with any rigour. This is partly because to do so requires significant skills, and partly because they do not want to rock the boat. The major games relate to minor shading of results, for example the hypertension target is under 150/90, which is not exactly demanding. There seem to be quite a few patients coming ins at 148/88 and similar values.

The targets are not very tough (See Figure 1)! Most practices get maximum marks. There are a few exceptions, for example university student practices, where there are so few people with chronic diseases that it is nearly impossible to get a high score. This is dealt with by local informal special funding arrangements. The targets were originally set with no baseline data, so the maximum and minimum cut-offs were largely made up.

There is a practice called exception reporting. This allows a GP to declare that specific patients, for stated reasons, will not be counted. A good example is the use of beta-blockers after a heart attack. For some patients these are not advised because the patient has a condition which would be worsened by the drug, so these patients are ‘exception reported’ from the heart attack register. However, there is evidence that many practices use exception reporting to game the system, and that practices with high rates of exception reporting are likely to be of poor quality overall.

The targets have been revised somewhat since they were set up, but the targets for maximum payment have hardly been shifted at all, even though most practices are hitting these. A proposal that these targets should be reset to the 75th centile (the cut-off between the top quarter of practices, and the bottom three quarters), was rejected.

There is modest evidence that treatments and patients with diseases which were not incentivised by the QOF scheme have suffered.

Mental health is not covered by QOF at all, partly because it was too hard to come up with indicators.

Advice

The question of whether the speakers would recommend other countries to introduce the QOF was extensively discussed at the meeting. The final answer was ‘Yes-ish’. The recommendations below are what I would recommend before thinking about a QOF for Ireland.

  • Establish baseline values for any proposed indicators for a year or two before introducing anything.
  • Extract data directly from the GP EHR systems, with no practice-level intervention.
  • Monitor patterns of care closely.
  • Allow exception reporting, but monitor it closely.
  • Prohibit dumping difficult patients (which is common in the USA).
  • Set tough targets, based on evidence.
  • Possibly give full payment only for 100% compliance with the target, or for a 75th centile performance, revised each year.
  • Revise these targets regularly
  • Look at the Kaiser system, where practices are evaluated on targets, but do not know till the end of the relevant year what those targets were. This makes gaming pointless, and encourages a wide view of practice improvement

Paying for third level – a fairer alternative to fees?

There are two widely held beliefs about paying for third level. The first is that universities cannot continue to be largely funded from general taxation, as at present. The second is that Irish universities are underfunded, and this is why they have slipped down the league tables. As a result there is a modest panic about paying for universities.

Prof. Michael Murphy, the president of UCC, in an interview with Sean Kelly (Irish Times, Nov 12th), blew on the flames, saying that “Student fees of at least €4,500-€5,000 per year are necessary to maintain the quality of higher education in Ireland” and “as graduates gained a significant income premium from their degree, it was right that those who can afford to pay fees be asked to make a more significant contribution.”

Prof. Murphy is of course right about the income premium. OECD figures for Ireland up to 2004, suggest that graduates, as compared with someone who only completes secondary school, can earn 30% to 70% more. More recent Irish data are not available, but the more recent figures for other OECD states are similar. These figures are for extra earnings across a working lifetime (20 to 64).

How do we pay for third-level education now? It’s hard to get a good picture of the finances of the whole sector, and there are big differences between institutions, especially between the ITs and the universities. The HEA pay the bulk of the costs, apparently 65% to 90%+, depending on the institution. They paid just under €1.35 billion in ordinary grants to all third level institutions in 2009. Of this €769 million went to the university sector. Student ‘registration fees’, now running at €2,000 a year, are said to pay about half the costs of ‘direct student services’, a rather vague term.

Income from research grants, campus companies, patent licensing, conferences, accommodation, catering, rental income, and other university enterprises, makes up the rest. It is not clear whether these other activities even cover their own costs, as there are weak costing and management information systems in the sector. In any event, the bulk of funding comes direct, as a per-capita grant, from HEA, i.e. from general taxation, and so, non-graduates subsidize graduates. This seems unfair, as Prof. Murphy rightly suggests.

The return of fees is touted as a solution. Our neighbours in England have just brought in fees of £9,000 a year, and got a 12 % drop in applications to third level. They do have an efficient scheme of student loans, where repayments are deducted directly from salaries, once the student earns above a modest level, and interest rates are subsidized. The US has an odd system, with very high fees, student loans, and default rates running at 10% overall, and up to 80% in the worst of the private colleges (think mortgage misselling tactics applied to degrees). Most other EU countries have either no fees, or modest fees. We have nothing.

What would bringing in fees do? This would help to fix the funding gap in the sector, although to do this they would need to be closer to €10,000 or €12,000, than the figures of €3,000 to €4,000 being discussed. This would throw much of the burden on current students, and their families. Students entering in the next few years seem likely to be hit for fees. Those whose families can afford it, will graduate with few debts. Those whose families cannot, will either not go, as the recent English experience suggests, or will take on significant debts to do so.

Assuming we develop a system more like England than the US, these students will then repay their loans over 20 to 30 years, by direct deduction from their salaries. Older graduates, like me, would pay nothing for our education. We have already benefited from third level education, which received significant public subsidies, and, in many cases, our parents paid the fees.

Wouldn’t it be better to think of a graduate tax? The effect of this would be similar to a loan repayment deducted from salary, but a lot more people would contribute, so it would spread the costs more fairly. Every graduate earning above a set level would pay, and it would be deducted directly, like PRSI, and the universal social charge. No costly new systems would be required, and the administrative costs of tracking 40,000 graduates a year, across the world, for twenty or thirty years, would be avoided. There would be a once-off cost for registering graduates, but this would not be too hard. The tax would cover all graduates, whether of Irish, or foreign, third level institutions. This would ensure that all graduates would contribute to the costs of third level education.

This might be seen to be unfair to older graduates, as students paid tuition fees up to 1996. However, most graduates under the age of sixty have benefited from significant public subsidies to third level, which have been a feature of the Irish system since the late 1960’s, so it seems fair that we should contribute now.

What rate of tax would be needed to raise €2 billion a year? A rough estimate can be made. In 2010 the top 1% of income earners paid 25% of income tax, the top 8% paid 60% of of the tax, and the top 21% 83% of the tax. In 2010 it was estimated, by the Dept. of Finance, that a 1% rise in the health levy would raise €600m. If we assume the same ratio applies, then 21% of the population paying a 3% levy would raise €1.4 billion.

This suggests that a graduate tax paid at zero for low earning graduates (e.g. under €30,000), 2% for lower earners (e.g under €50,000), and 3% for higher earners would pay for Irish third level into the foreseeable future. These are not trivial sums, but they are not especially onerous either. In the UK new graduates now pay up to 9% of their income for up to 25 years to repay their loans.

There is a major effort to bounce us into bringing back student fees, but it’s not too late to change our minds. There are better, cheaper, and fairer options, and a graduate tax is one.